Bitcoin Technical Analysis: BTC/USD another bullish pattern sees the bulls eyes light up, buckle up
- Bitcoin price was seen holding modest gains on Wednesday of 0.20%,
- BTC/USD price action has formed a bullish pennant pattern, subject to an extended breakout to the upside.
- Price on the larger picture is still moving higher within an ascending channel pattern.

BTC/USD 60-minute chart
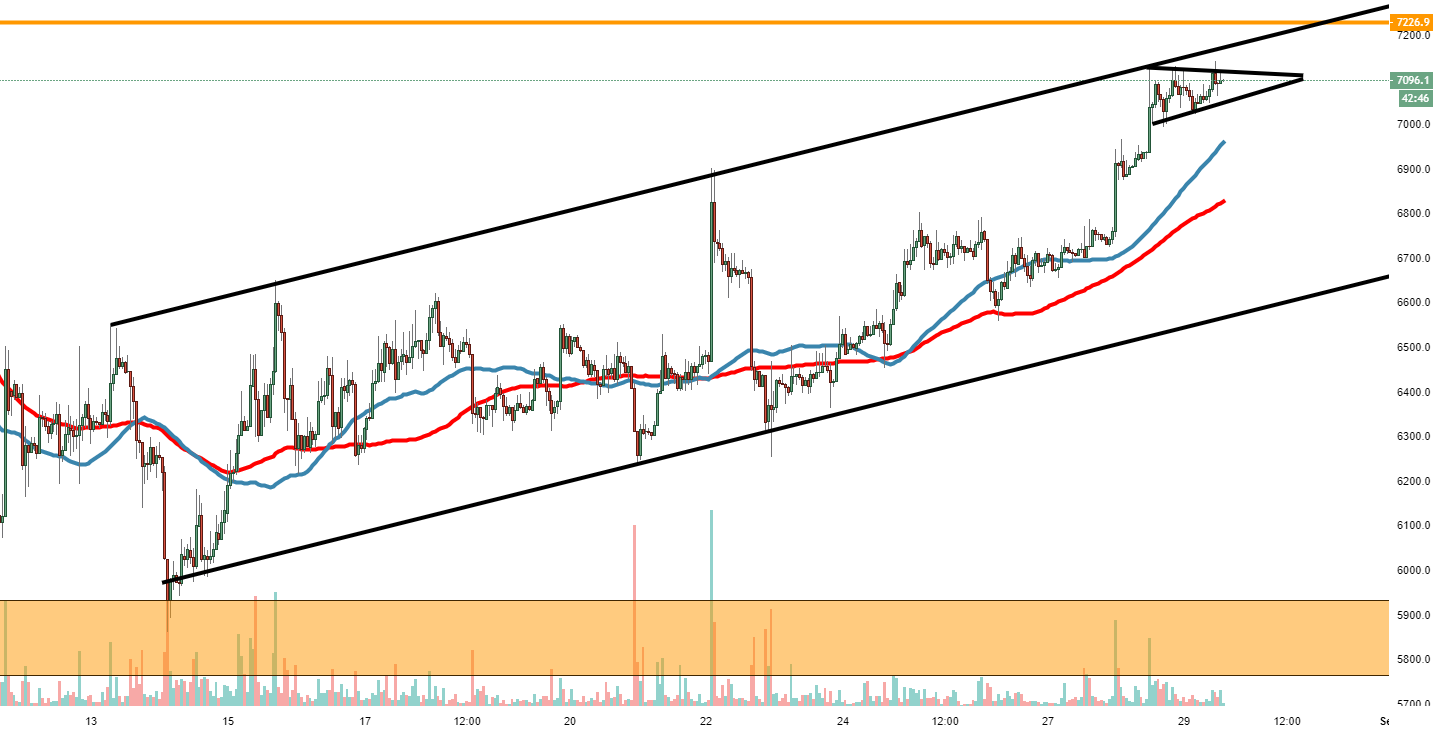
Spot rate: 7098.5
Relative change: +0.25%
High: 7139.4
Low: 7021.3
Trend: Bullish
Resistance 1: 7116.6,upper part of pennant.
Resistance 2: 7139.4, today's (Wednesday) high.
Resistance 3: 7175.0, upper part of rising channel.
Support 1: 7053.8, lower part of pennant.
Support 2: 6959.6, 50MA.
Support 3: 6829.5, 100MA & top area of 22nd August.
Author

Ken Chigbo
Independent Analyst
Ken has over 8 years exposure to the financial markets. He started his career as an analyst, covering a variety of asset classes; forex, fixed income, commodities and equities.
More from Ken Chigbo


