Bitcoin is headed for a long-term support retest, data suggests, after BTC price action fell into the August monthly close.

Chart

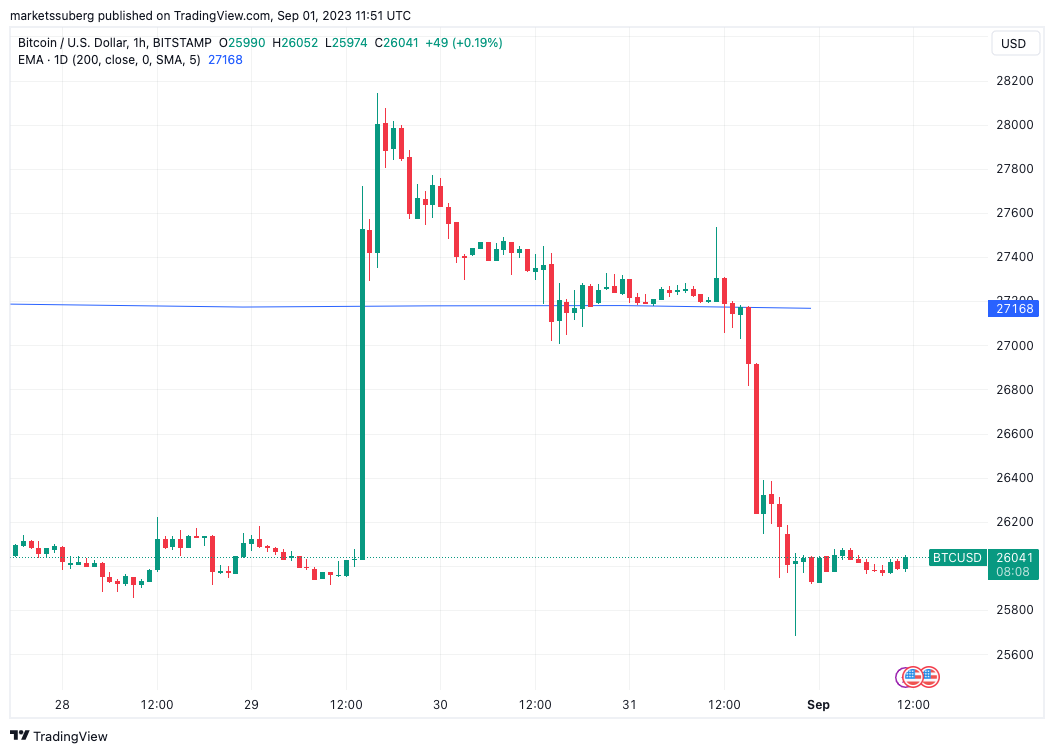
BTC/USD 1-hour chart. Source: TradingView

BTC price: Roads point to $23,000

Reversing gains seen last week, BTC/USD is back below $26,000 as of Sep. 1, data from Cointelegraph Markets Pro and TradingView shows.

Market participants had seen cause for bullishness into the close, with Bitcoin holding a key long-term trendline and preserving $27,000.

A decision by the United States Securities and Exchange Commission (SEC) to delay a slew of Bitcoin spot price exchange-traded fund (ETF) applications forced a rethink, with Bitcoin shedding $1,000 over just two hourly candles.

Now, observers are concerned that even current levels may fail to hold the market up for long.

“On-chain data suggests that $BTC lacks strong support below the $25,400 mark,” popular trader Ali told X (formerly Twitter) subscribers.

If BTC breaks below this threshold, it could swiftly correct down to $23,340.

Chart

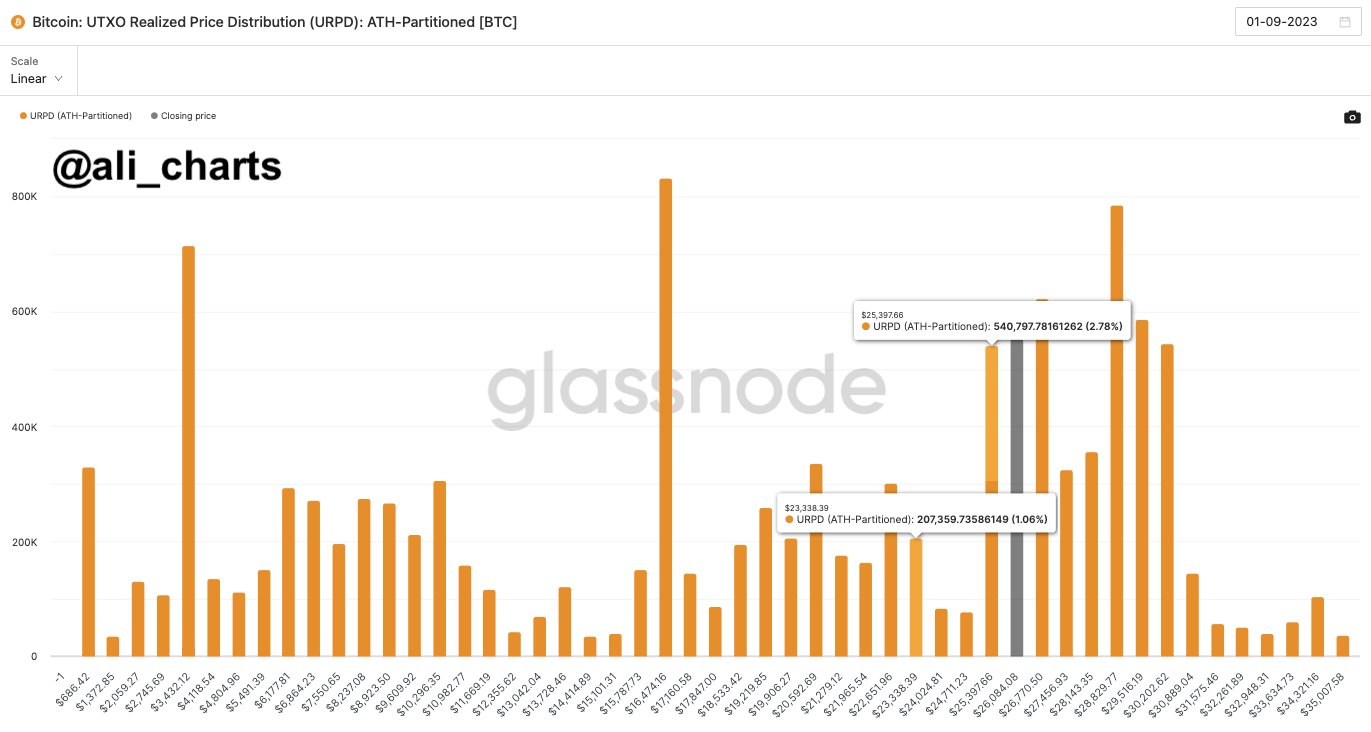
UTXO realized price distribution (URPD) annotated chart. Source: Ali/X

Ali uploaded a chart of the UTXO realized price distribution (URPD) metric from on-chain analytics firm Glassnode.

This tracks the price at which the current set of transaction outputs was created and functions as a roadmap for likely price support and resistance levels.

A breakdown to $23,000 would not come as a surprise to some, with that target already on the radar for various traders and analysts.

Bitcoin inches toward key support battleground

Continuing, on-chain monitoring resource Material Indicators delivered a similarly grim picture for BTC/USD on daily (D), weekly (W) and even monthly (M) timeframes.

Using signals from one of its proprietary trading tools, Trend Precognition, Material Indicators advised that $24,750 needed to hold for bulls to have a chance at clinching a rebound.

“If price moves and holds below $25,350 the W signal will invalidate, however, if support holds above the LL at $24,750 there will be a good foundation to rally from and retest resistance,” part of X commentary explained.

We will look to the Monthly candle open for a signal from the Trend Precognition algos to gain insight to whether we can expect an extension of the downtrend or a monthly momentum shift to the upside.

Chart

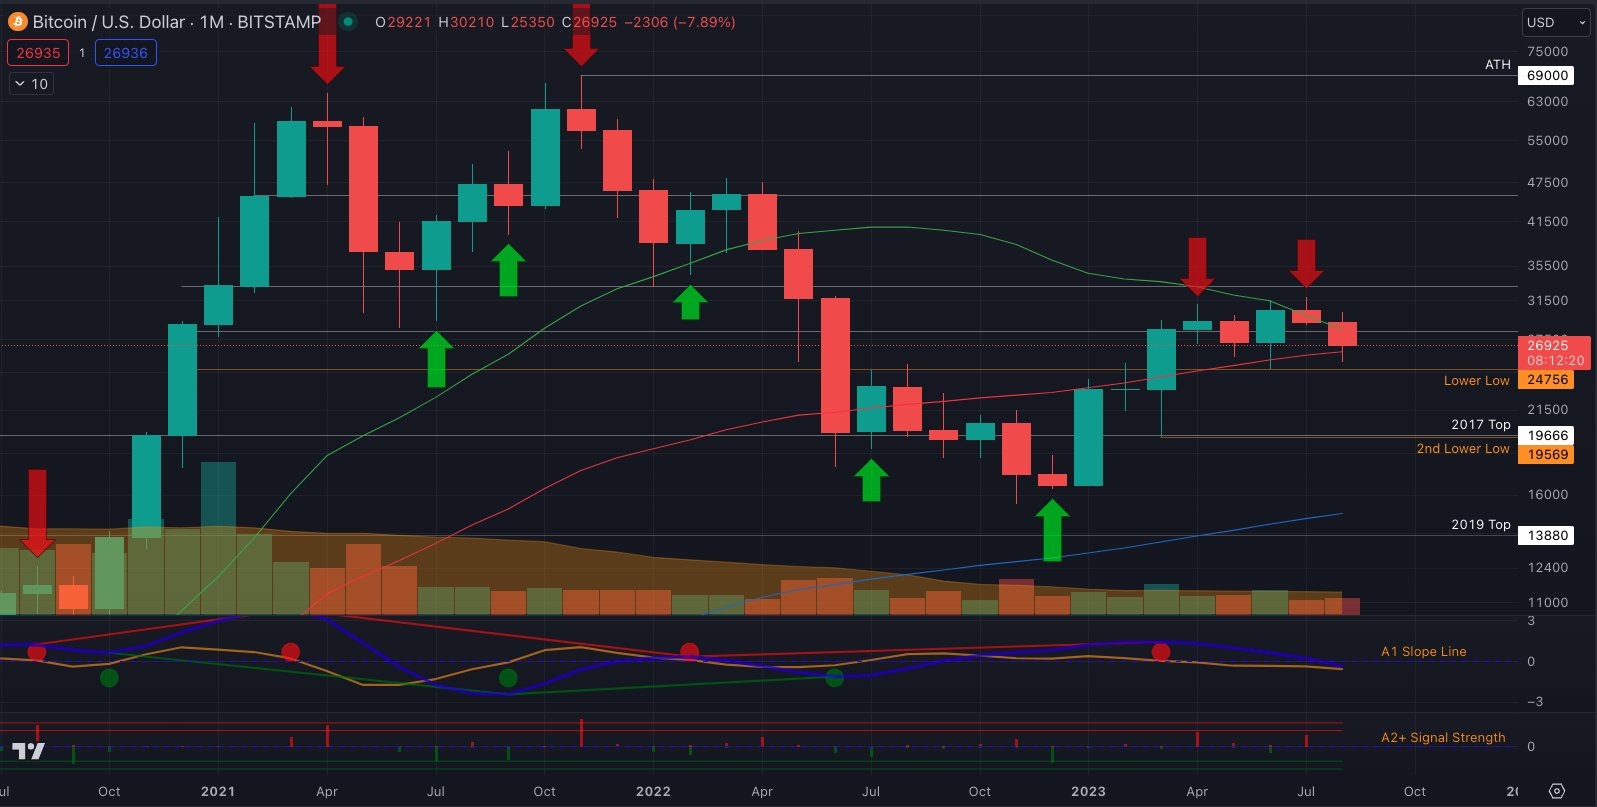
BTC/USD 1-month chart with Trend Precognition signals. Source: Material Indicators/X

Data from CoinGlass meanwhile showed Aug. 31 sparking the largest volume of BTC long liquidations since Bitcoin’s 10% dive earlier in the month. 

These came in at $41 million, with the cross-crypto total at $108 million — still far below the daily tally from two weeks prior.

Chart

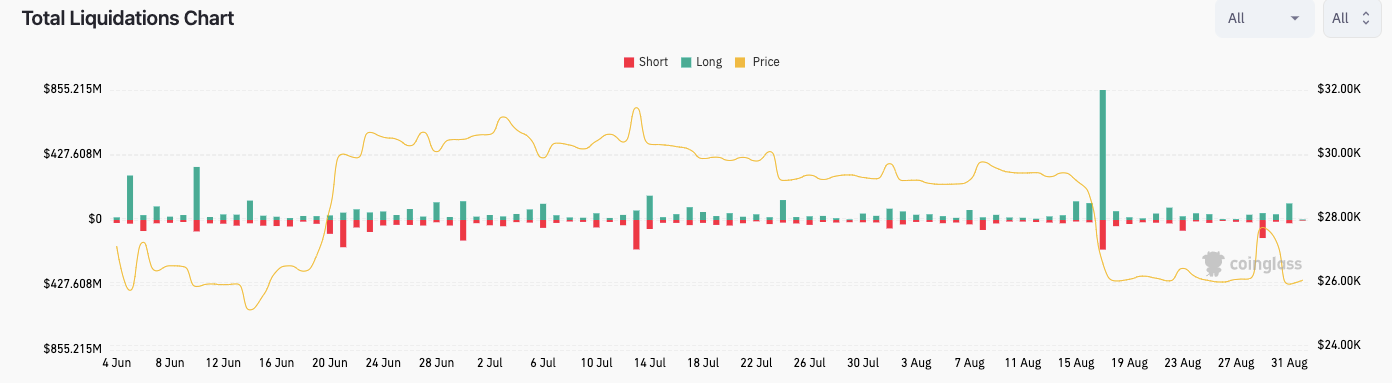
Crypto liquidations chart (screenshot). Source: CoinGlass


Information on these pages contains forward-looking statements that involve risks and uncertainties. Markets and instruments profiled on this page are for informational purposes only and should not in any way come across as a recommendation to buy or sell in these assets. You should do your own thorough research before making any investment decisions. FXStreet does not in any way guarantee that this information is free from mistakes, errors, or material misstatements. It also does not guarantee that this information is of a timely nature. Investing in Open Markets involves a great deal of risk, including the loss of all or a portion of your investment, as well as emotional distress. All risks, losses and costs associated with investing, including total loss of principal, are your responsibility. The views and opinions expressed in this article are those of the authors and do not necessarily reflect the official policy or position of FXStreet nor its advertisers.

Join Telegram

Recommended content


Recommended Content

Editors’ Picks

Ripple on-chain metrics show bullish signs amidst legal struggle with SEC, XRP eyes recovery

Ripple on-chain metrics show bullish signs amidst legal struggle with SEC, XRP eyes recovery

Ripple made a comeback above $0.48 on Tuesday and hovers above that level in Wednesday’s European session. Ripple on-chain metrics such as transaction volume and Network Realized Profit/Loss have turned bullish, supporting a recovery in the altcoin. 

More Ripple News

Bitcoin price falls amidst German government transfers, miners activity

Bitcoin price falls amidst German government transfers, miners activity

Bitcoin (BTC) extends correction on Wednesday and hovers around $61,000 after finding resistance near the $64,000 level on Monday. Recent on-chain data indicates heightened selling activity from Bitcoin miners early in the week. 

More Bitcoin News

Crypto Today: Bitcoin erases gains from end of June, Ethereum declines while Ripple holds

Crypto Today: Bitcoin erases gains from end of June, Ethereum declines while Ripple holds

Bitcoin wipes out gains from the last week of June and falls below $60,000 on Wednesday. Ethereum and top altcoins ranked by market capitalization erased gains as the inflation outlook worsened. Ripple holds on to recent gains and hovers above $0.48 on Wednesday. 

More Cryptocurrencies News

Three reasons why altcoins could shake off losses this week

Three reasons why altcoins could shake off losses this week

On-chain data from Santiment shows that altcoins are currently in the opportunity zone, or generating buy signals. The top three altcoins in the buy zone are Basic Attention Token (BAT), Chromia (CHR), and Highstreet (HIGH), per Santiment. 

More Altcoins News

Bitcoin: BTC price correction could end in July, according to seasonal data

Bitcoin: BTC price correction could end in July, according to seasonal data

Bitcoin (BTC) price appears poised for a decline this week, influenced by slight outflows in US spot ETFs, selling activity among BTC miners, and a combined transfer of 4,690.28 BTC to centralized exchanges by the US and German governments.

Read full analysis

BTC

ETH

XRP