Bitcoin eyes $60,000 as technical indicators point to rally ahead
- Bitcoin price bounces off from $56,000 daily support level, eyeing for a rally ahead.
- US Spot ETFs record mild outflows of $43.90 million on Wednesday.
- Technical indicators and on-chain data point to a rally ahead.

Bitcoin (BTC) price trades slightly higher around $58,000 on Thursday after finding support around the $56,000 level on Wednesday, supported by an improved market mood for risk assets. This recovery happens despite US Bitcoin Spot Exchange Traded Funds (ETF) recorded mild outflows on Wednesday. On-chain data projects a rise in Bitcoin’s price as its exchange reserves are decreasing and the long-to-short ratio trades above one.
Daily digest market movers: US CPI data spurs risk-on tone
Bitcoin price strengthened after the United States (US) released the August Consumer Price Index (CPI). The US Bureau of Labor Statistics reported that the annual CPI rose 2.5% YoY, easing from the previous 2.9%. Also, the core annual figure matched the July one and expectations by printing at 3.2%. However, the monthly core increase was higher than anticipated, hitting 0.3%.
The data suggested that the US Federal Reserve (Fed) will opt to cut interest rates by 25 basis points after its meeting next week, the first cut since 2019. The news propelled US stock markets, and cryptocurrency markets followed suit.
US Bitcoin Spot Exchange Traded Funds (ETF) data recorded an outflow of $43.90 million on Wednesday, the first outflows so far this week. Still, this outflow is small compared to the total Bitcoin reserves held by the 11 US spot Bitcoin ETFs, which total $49.34 billion in Assets Under Management (AUM).
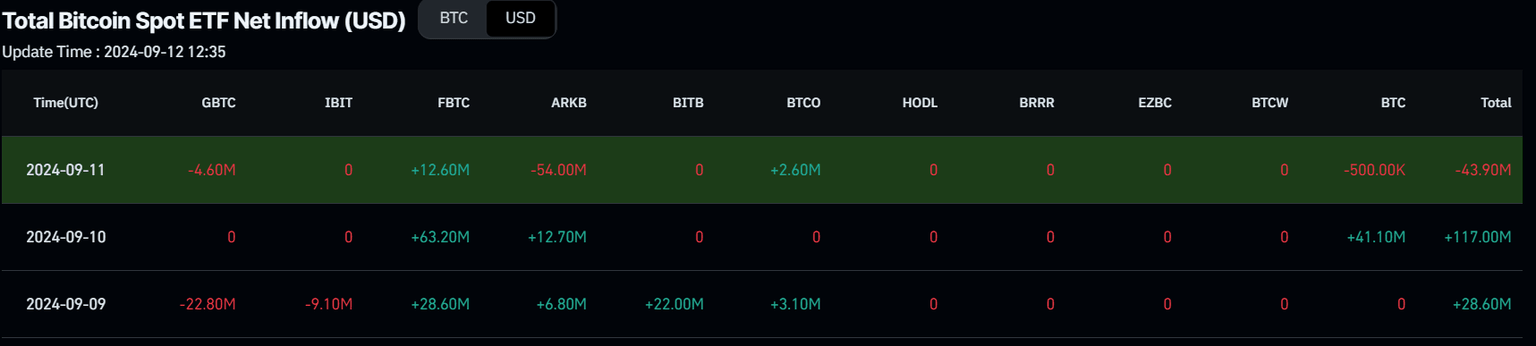

Bitcoin Spot EFT Net Inflow chart
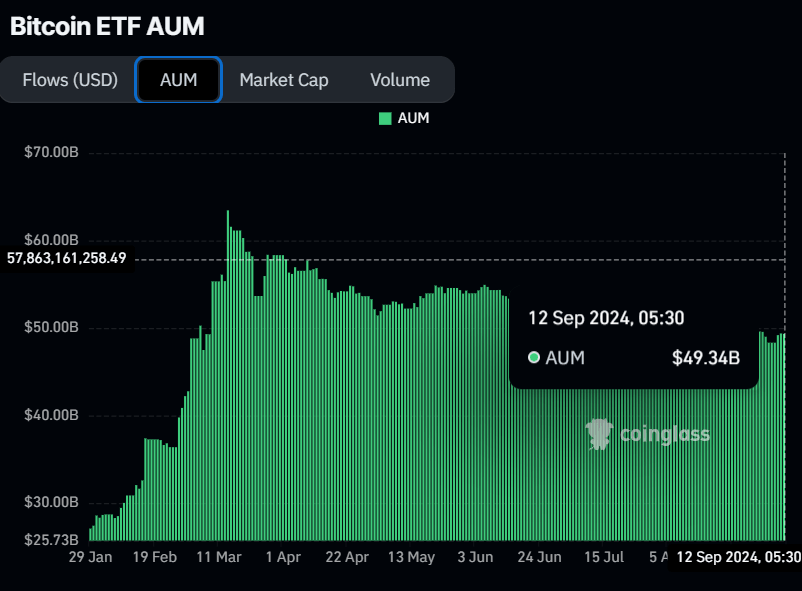
Bitcoin ETF AUM chart
Turning to on-chain metrics, Coinglass’s BTC’s long-to-short ratio is at 1.07, the highest level in almost one month and flipping above one on Thursday. This means more traders are betting on the asset’s price to rise.
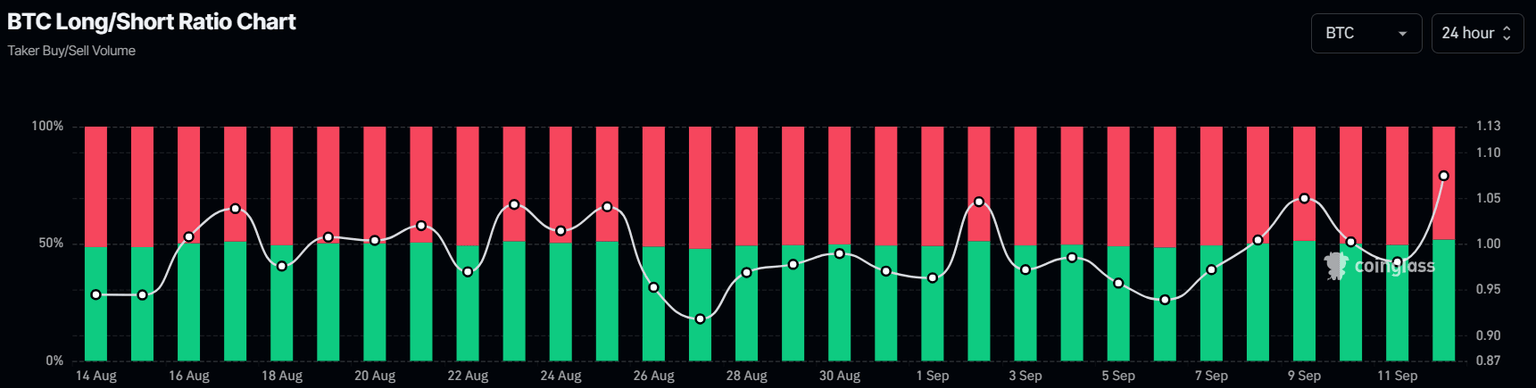
Bitcoin long-to-short ratio chart
CryptoQuant exchange reserve data is also positive for Bitcoin. The data provides insights into the level of accumulated selling pressure within an exchange. This metric stands at 2.5 million BTC, the lowest level since November 2018, and has constantly declined since mid-August. The decreasing reserve indicates that investors are more inclined to withdraw their crypto from the exchange for purposes other than immediate selling, thereby reducing the supply available for trading, bolstering a bullish outlook for Bitcoin price.
-638617351738721544.png&w=1536&q=95)
Bitcoin Exchange Reserve chart
Technical analysis: BTC bounces off $56,000
Bitcoin price retested the daily support of $56,022 on Wednesday and bounced from it. At the time of writing, it continues to rise by 1.1% on Thursday at $57,965.
If the $56,022 daily support holds, BTC could continue to rise to restest $59,529, its 50% price retracement level (drawn from a high in late July to a low in early August).
This rise in Bitcoin’s price is additionally supported by the Moving Average Convergence Divergence (MACD) indicator on the daily chart. The MACD line (12-day Exponential Moving Average, blue line) rises above the signal line (26-day Exponential Moving Average, yellow line), giving a buy signal. It shows green histogram bars above the neutral line zero, also suggesting that the asset’s price could experience upward momentum.
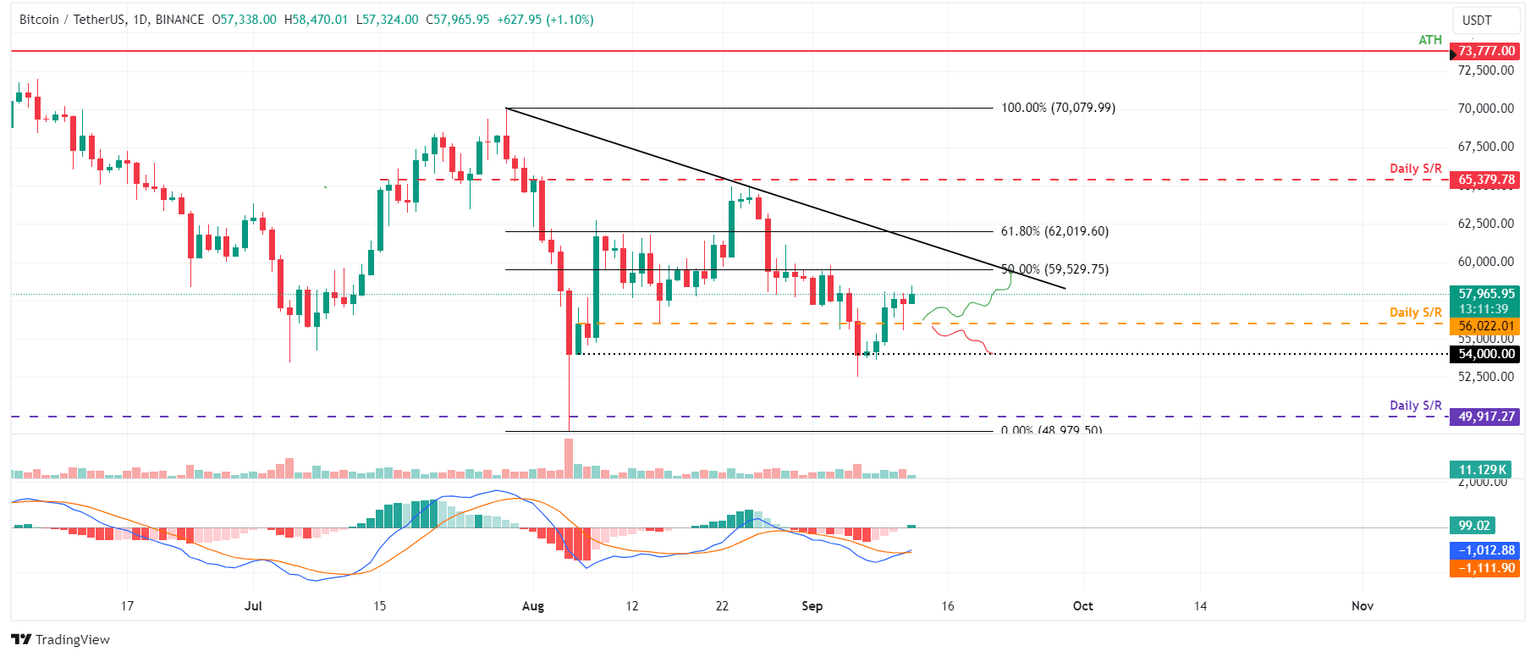
BTC/USDT daily chart
However, the bullish thesis would be invalidated if Bitcoin closes below the $56,022 level. In this scenario, BTC could decline by another 3.5% to restest its psychologically important of $54,000.
Bitcoin, altcoins, stablecoins FAQs
Bitcoin is the largest cryptocurrency by market capitalization, a virtual currency designed to serve as money. This form of payment cannot be controlled by any one person, group, or entity, which eliminates the need for third-party participation during financial transactions.
Altcoins are any cryptocurrency apart from Bitcoin, but some also regard Ethereum as a non-altcoin because it is from these two cryptocurrencies that forking happens. If this is true, then Litecoin is the first altcoin, forked from the Bitcoin protocol and, therefore, an “improved” version of it.
Stablecoins are cryptocurrencies designed to have a stable price, with their value backed by a reserve of the asset it represents. To achieve this, the value of any one stablecoin is pegged to a commodity or financial instrument, such as the US Dollar (USD), with its supply regulated by an algorithm or demand. The main goal of stablecoins is to provide an on/off-ramp for investors willing to trade and invest in cryptocurrencies. Stablecoins also allow investors to store value since cryptocurrencies, in general, are subject to volatility.
Bitcoin dominance is the ratio of Bitcoin's market capitalization to the total market capitalization of all cryptocurrencies combined. It provides a clear picture of Bitcoin’s interest among investors. A high BTC dominance typically happens before and during a bull run, in which investors resort to investing in relatively stable and high market capitalization cryptocurrency like Bitcoin. A drop in BTC dominance usually means that investors are moving their capital and/or profits to altcoins in a quest for higher returns, which usually triggers an explosion of altcoin rallies.
Author

Manish Chhetri
FXStreet
Manish Chhetri is a crypto specialist with over four years of experience in the cryptocurrency industry.


