Bitcoin Quarterly Forecast: BTC to hit $100,000 before its next bear market
- Bitcoin price closed the quarter where it started.
- Bitcoin likely to extend higher, matching or exceeding all-time highs.
- Major bearish turn in the market could occur near the end of Q2.

This analysis will review Bitcoin’s performance over the past quarter and an outlook for what could be expected for Q2 - and beyond.
Bitcoin Price Performance and Review for Q1 2022
Bitcoin price changed very little over the past quarter (January 2022 – March 2022). Compared to Q4 2021, the 3-month candlesticks show near mirror images of each other. The final 3-month candlestick in 2021 shows a massive wick/shadow that made new all-time highs, followed by selling pressure that closed the 3-month candlestick with a marginal gain. Bitcoin opened Q4 2021 at $43,829 and closed at $46,218.
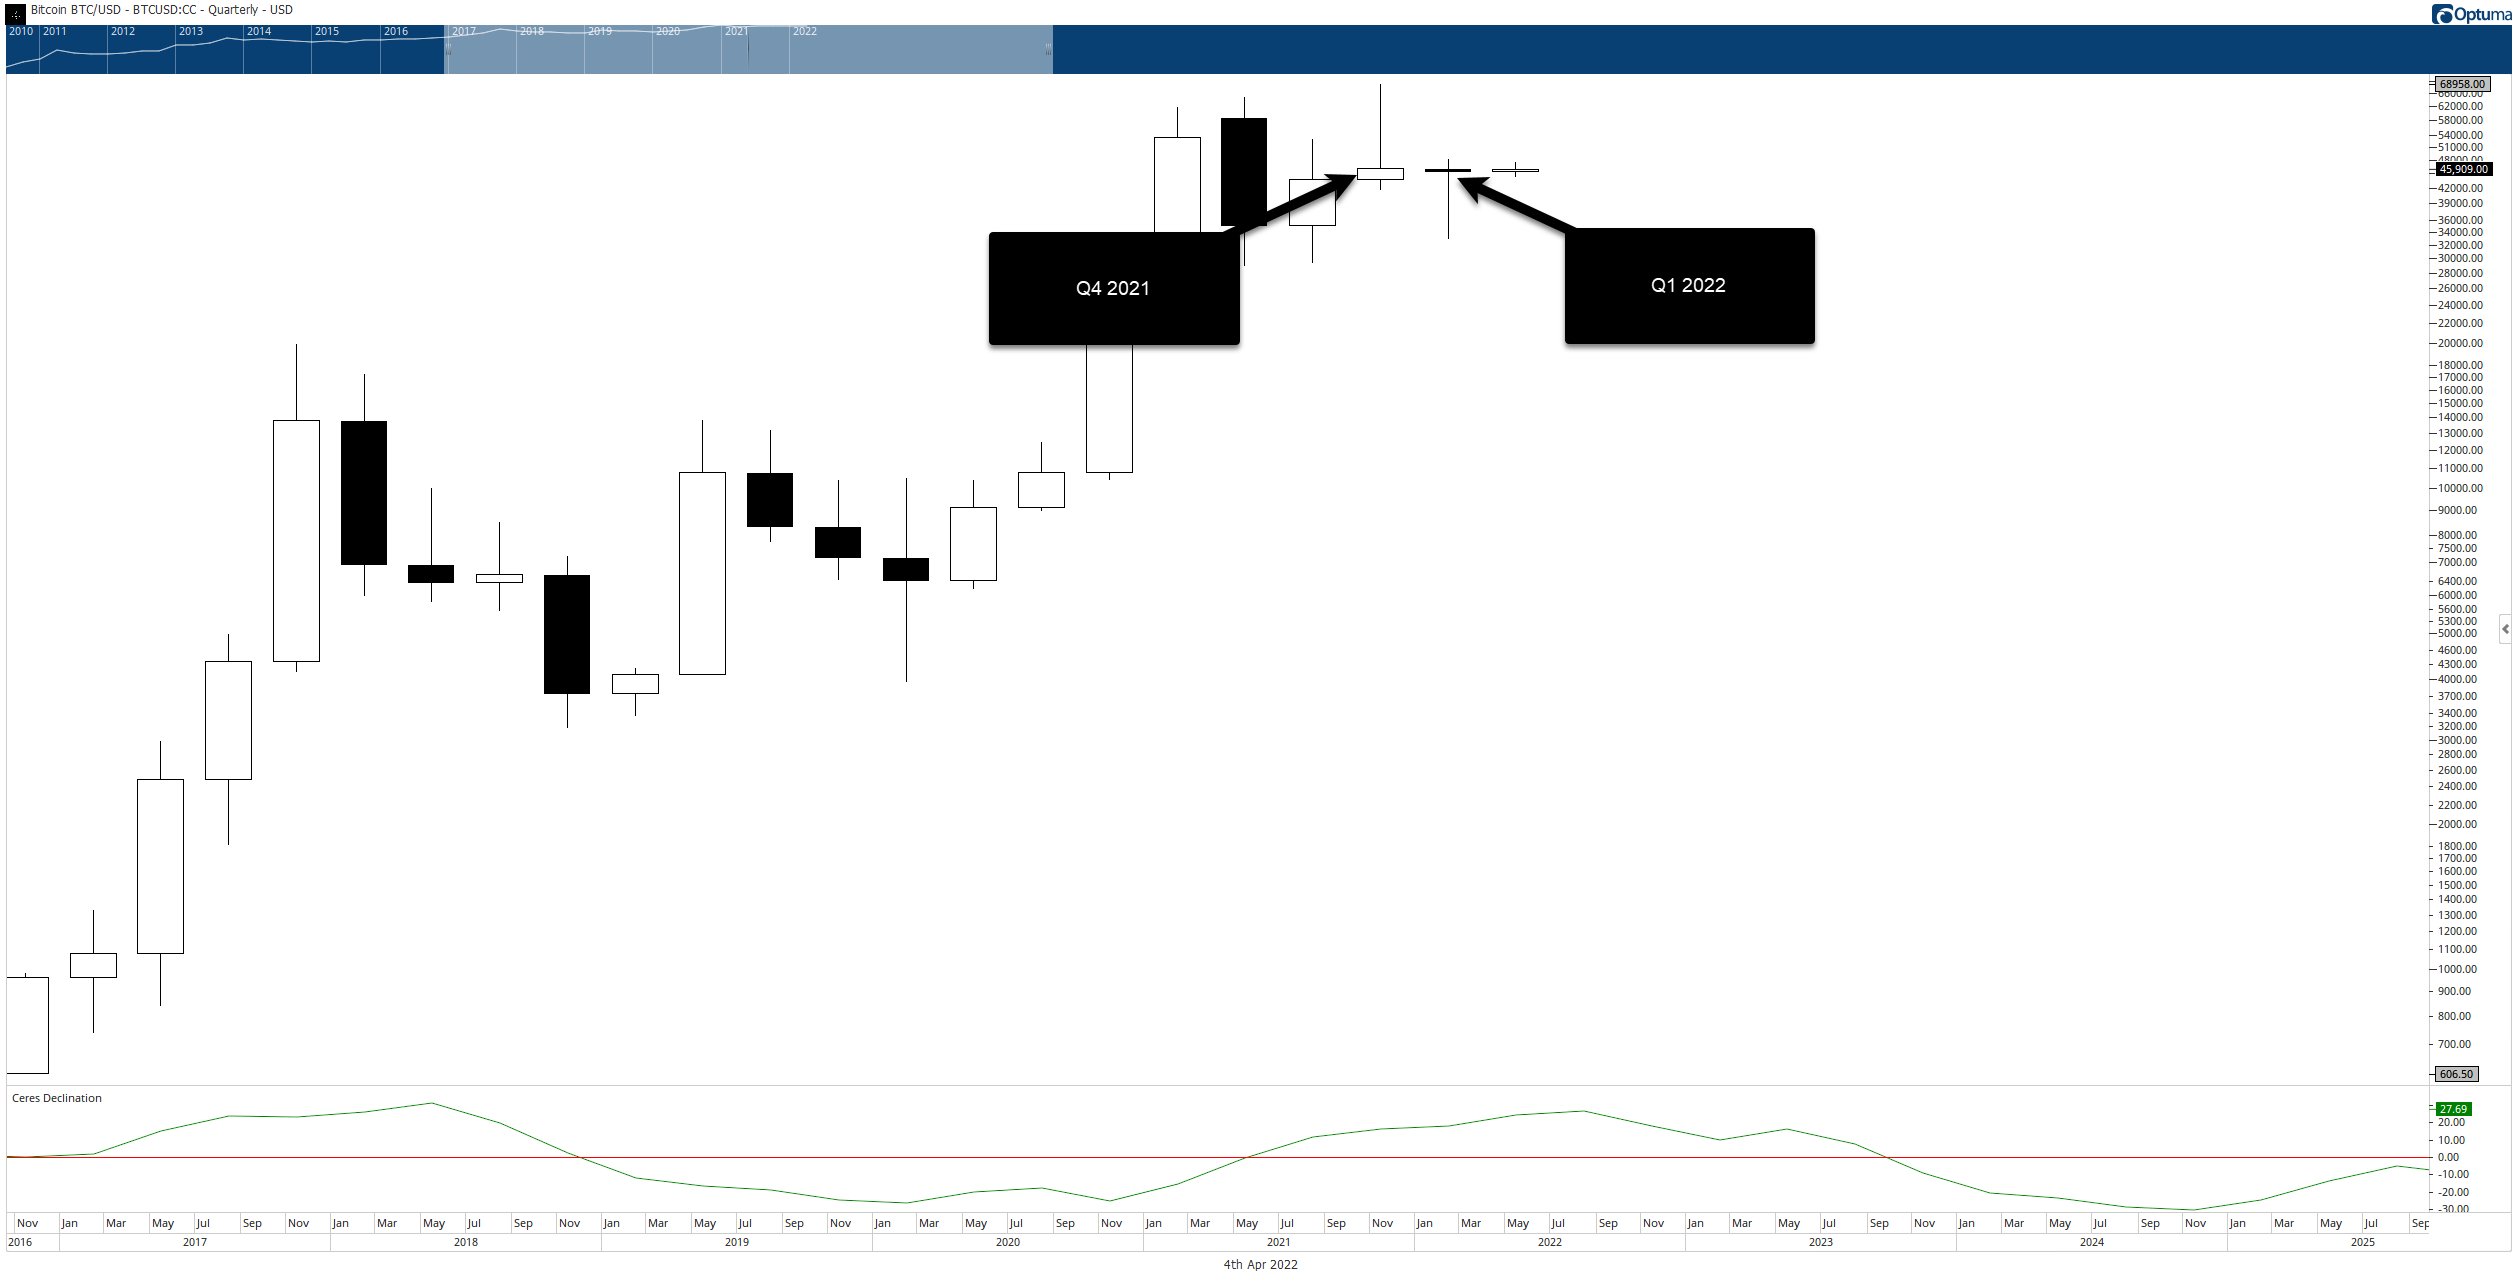
BTC/USD Quarterly Chart
For Q1 2022, the inverse occurred, with Bitcoin price spiking lower and hitting new six-month lows before rallying and closing nearly right where the 3-month candlestick opened. Bitcoin opened Q1 at $$46,209 and closed at $45,536.
Ichimoku Kinko Hyo Q1 2022 Analysis
The Ichimoku Kinko Hyo system shows that Bitcoin's price remains overwhelmingly bullish remains in an overwhelmingly bullish state. Since Q2 2021, the 3-month Tenkan-Sen and Kijun-Sen have acted as BTC’s primary support. However, an upcoming Kumo Twist between Q3 2022 and Q4 2022 may signal a forthcoming bearish turnaround that may last well into 2024.
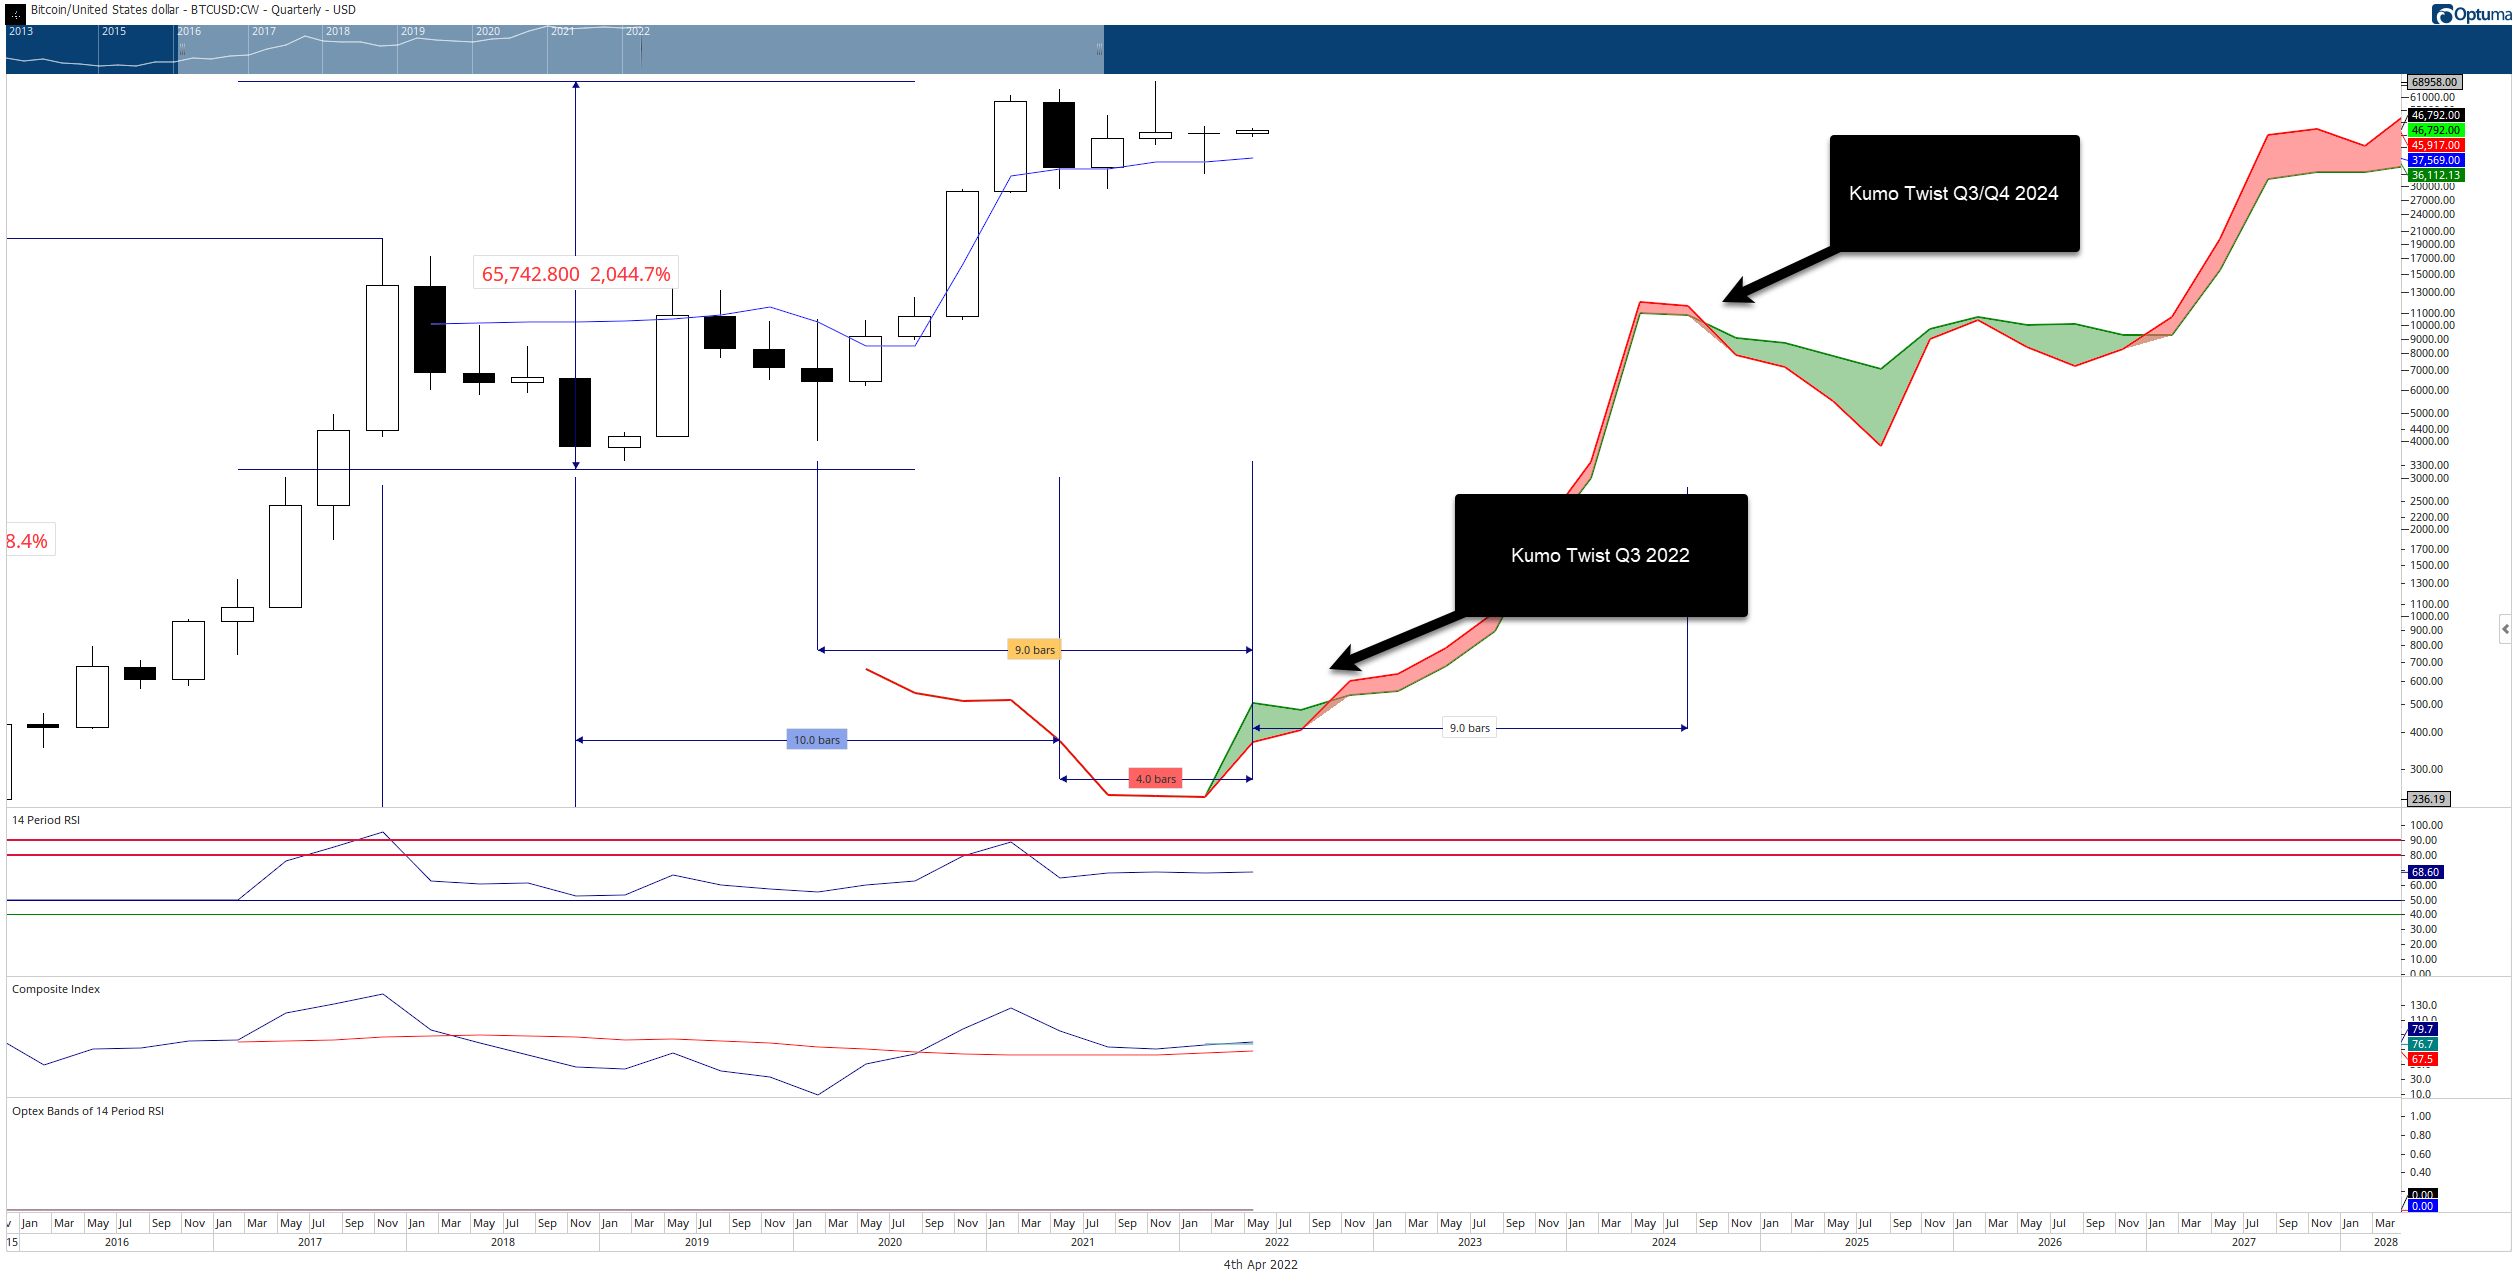
Quarterly Ichimoku Kinko Hyo Chart
From an oscillator perspective, Bitcoin price remains very neutral in the Relative Strength Index and the Composite Index. The Optex Bands oscillator, however, is near all-time lows.
Bitcoin Price Outlook for Q2 2022
From a Japanese candlestick perspective, the cryptocurrency market is witnessing a standard consolidation phase after a major breakout that began in Q2 2020 and culminated in Q1 2021. In Technical Analysis 101, consolidation after a strong move has a high probability of converting into a resumption of the prior trend – in this case, higher.
Except for Q2 2021, Q2 is historically one of the best performing quarters for Bitcoin price:
Q2 2011 – 1,952% gain
Q2 2012 – 36.29% gain
Q2 2013 – 4.82% gain
Q2 2014 – 40.22% gain
Q2 2015 – 7.52% gain
Q2 2016 – 61.15% gain
Q2 2017 – 127.18% gain
Q2 2018 – 7.74% loss
Q2 2019 – 162.61% gain
Q2 2020 – 42.19% gain
Q2 2021 – 40.40% loss
In the past ten years, the average return for Q2 has been a staggering 43.38%. From the Q2 2022 open, a 43.38% gain would put Bitcoin price at $65,288 – just shy of the all-time high of $68.958.
Price Confluence Zones
How are future price levels determined if they have never traded at those price levels before? A series of different types of analysis should be completed to speculate and project a future price range.
For this analysis, I will be utilizing Elliot Wave Theory, natural harmonic values found in the light and sound spectrum – specifically the methods by the great Gann analyst, Tony Plummer (The Law of Vibration, and The Life Cycle Hypothesis), Gann's Square of 9, Gann's Wheel of 24, Gann's Hexagon Chart, and Fibonacci Expansion zones.
The results of this analysis identified two primary ranges above Bitcoin's current value area to watch in 2022 for Bitcoin price:
$92,094 - $101,856 Price Zone
This range does not need advanced analysis to determine its importance. The $100,000 is the most important major price level that Bitcoin price will test since first breaking into the $10,000 price range. This range contains the 61.8% Fibonacci confluence level, Inner Octave of Fa, 180-degree Square of 9 Angle, 90-degree Dynamic Hexagon Angle, and the psychological $100,000 level.
Additionally, the $101,856 is derived from measuring Bitcoin’s prior bullish expansion phases and assuming a similar rate of contraction from one phase to the next. The result is a 347% gain from the April open – or $101,856.
$132,672 – 138,078 Price Zone
This range contains the Inner Octave Ti, 661.8% Fibonacci expansion, 360-degree Dynamic Hex Angle, 360-degree Square of 9 Angle, and 100% Fibonacci Confluence Zone.
Time Cycle Analysis
In addition to projecting price levels in the future, the same approach can be taken with time. For time cycle analysis, most of the analysis comes from Gann's work in major and minor time cycles and his use of astronomical cycles. The time studies are further supplemented with the Ichimoku Kinko Hyo system's Time Principle and Hurst Cycle Analysis.
After completing this analysis, a massive cluster of cycles complete and coalesce from mid-June 2022 to July 2022. Specifically, the Bitcoin price is projected to be at or near a new all-time high within June and July 2022. The time clusters include the following time cycle analysis method:
Gann's Square of 9 dates.
Gann's Cycle of the Inner year day counts.
Gann's Master Square of 12 weekly counts.
Gann's Master Square of 12 monthly counts.
Ichimoku Monthly Kumo Twist
Lunar Phase (New and Full Moons)
Lunar Apogee and Perigee
Hurst Cycles
Mid-Point of Gann's Square of a Range
Planetary Aspects
Anniversary Dates
Declination Cycle
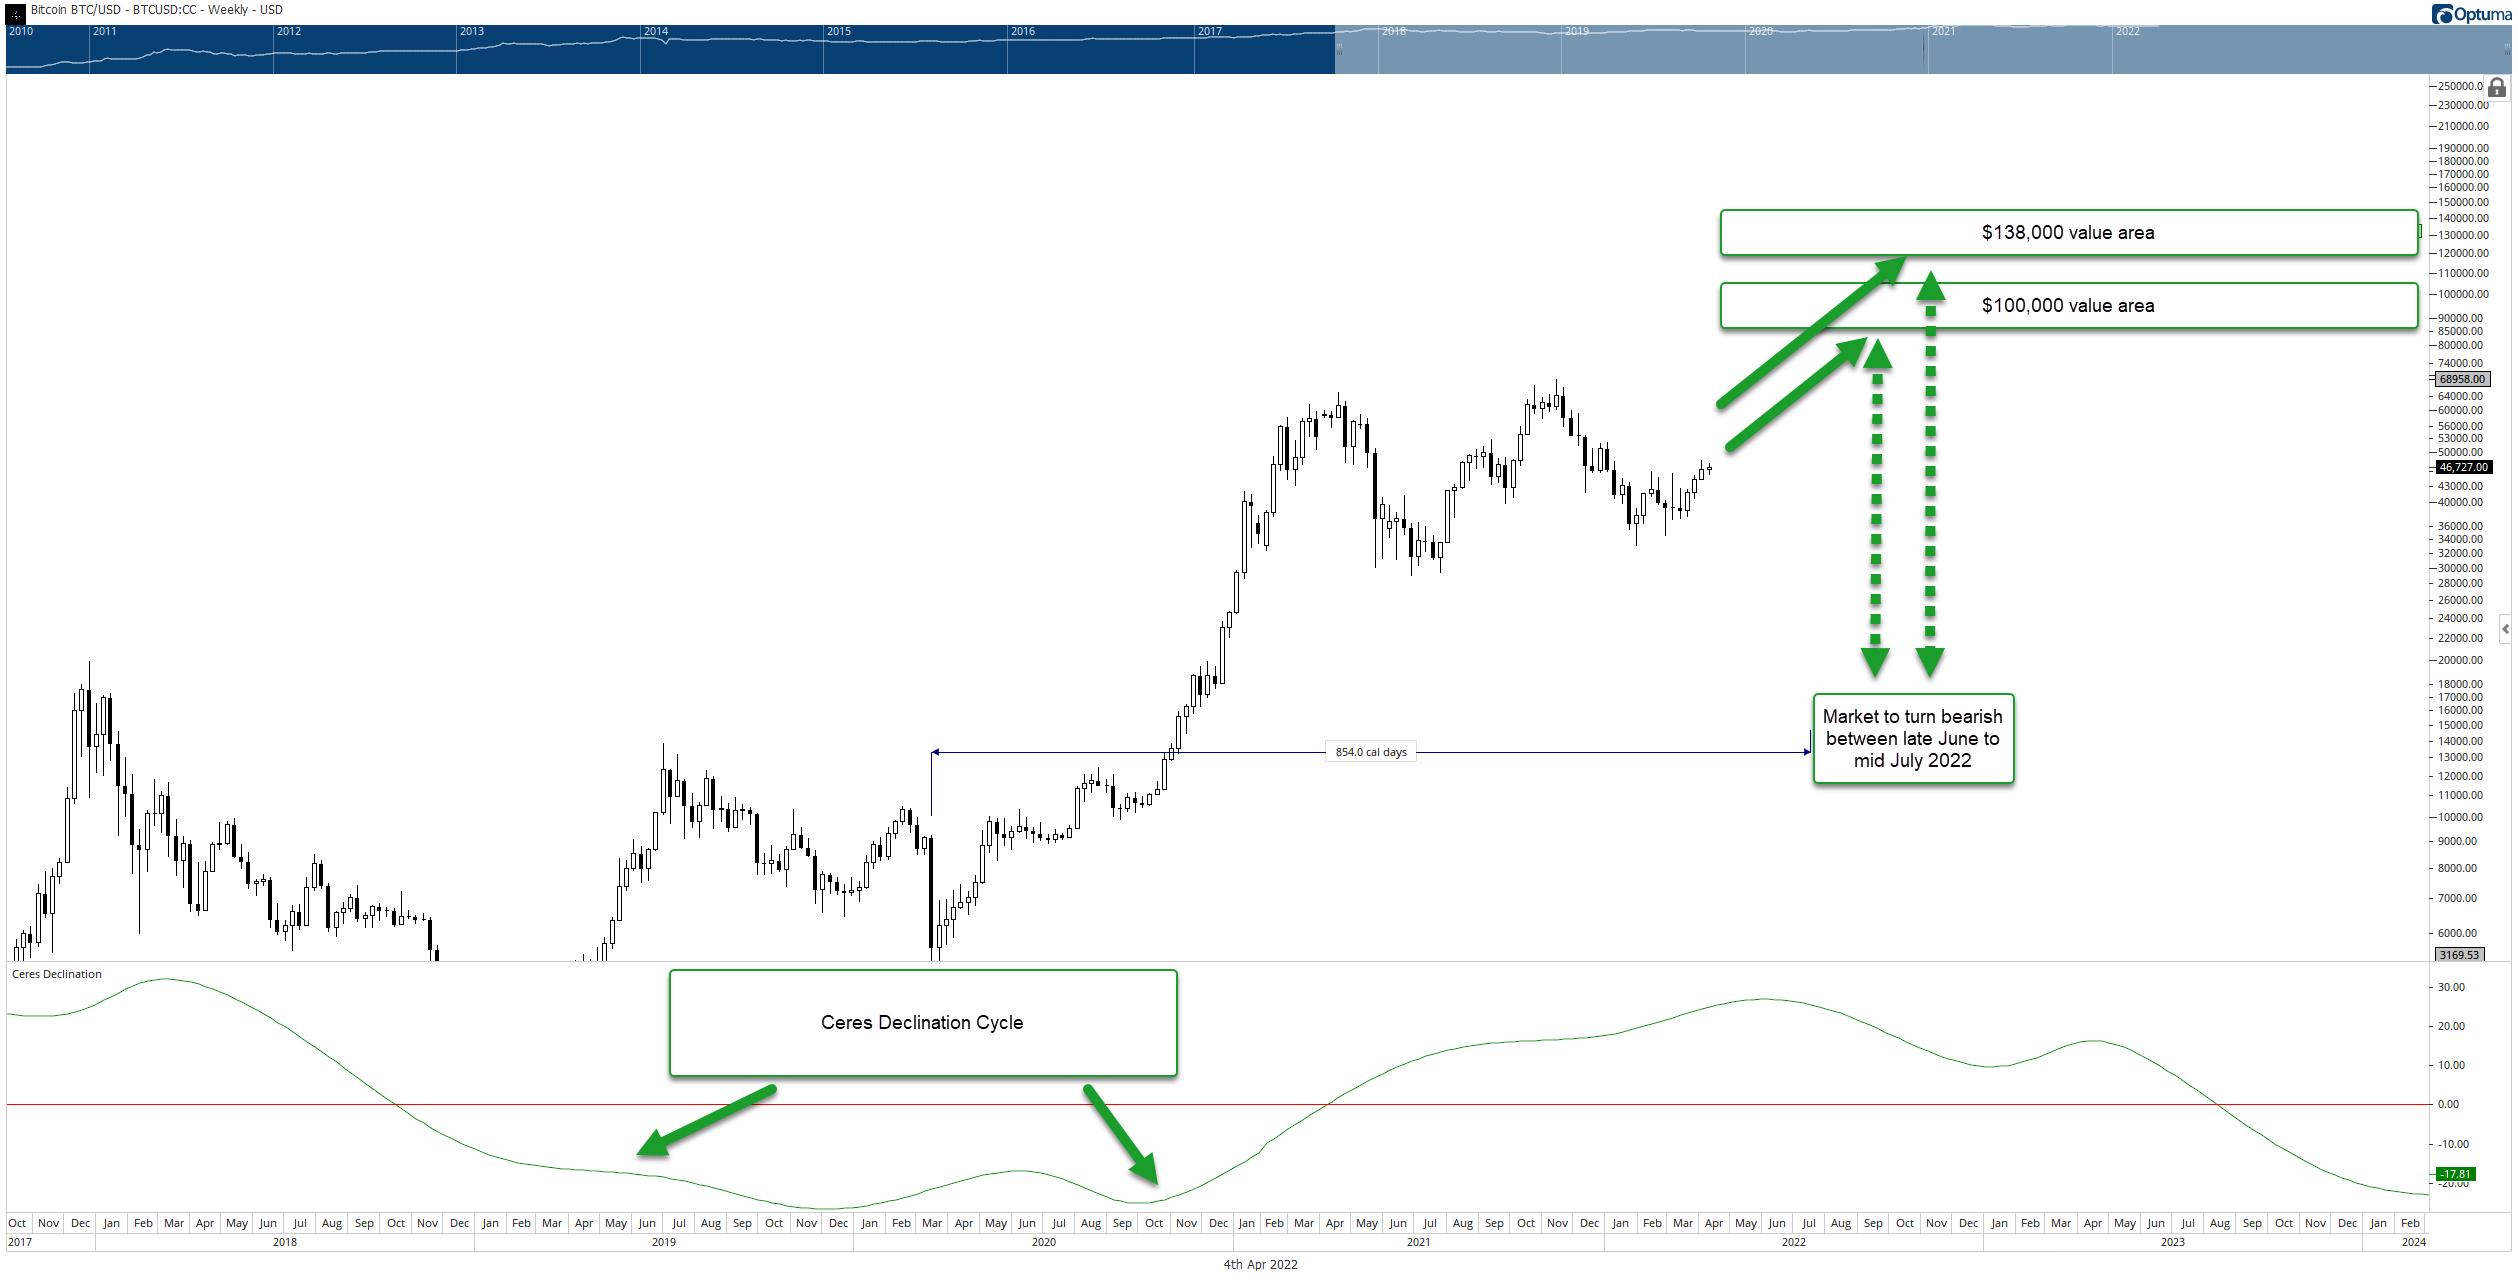
The 850-day Bitcoin bull cycle
While all cryptocurrencies, including Bitcoin, still have minimal data to complete a sufficient cycle analysis, some of those cycles are repeated. Both Bitcoin and Bitcoin show that their prominent bull runs last roughly 850 days (sometimes less, sometimes more).
However, the Cycle was interrupted and likely terminated during the Covid-19 crash in 2020. The likely reason for that termination event was not due to only Covid but due to the end of Bitcoin’s first 10-year cycle. That crash initiated a sort of reset button. The projected date range of the current bull market high is likely to terminate around the 854th day.
Ceres Declination Cycle
Perhaps the most critical component of this analysis is the major asteroid Ceres' Declination Cycle. Bitcoin price tends to closely follow the Ceres Declination swing cycle – almost too exact at times.
Bitcoin is very sensitive to this Cycle and has been for almost twelve years. The current Ceres Declination Cycle peaks in mid-June 2022 and begins to slope south in early July 2022. Additional Gann and astronomical cycle dates converge when the Ceres Declination cycles begin to slope down – all dates for 2022:
June 4 – Geocentric Mars Conjunct Jupiter exits
June 14 – 90-degree Square of 9 Date (from the 2020 Covid crash low)
June 30 – New Moon, Moon Apogee
July 14 – Full Moon, Moon Perigee
July 7 – Gann Seasonal Date
July 15 – New Square of a Range Time Cycle
July 15 – 854th day from the 2020 Covid crash low
July 27 – Earth Conjunct Pallas begins
Dates of importance beyond 2022, even 2023, can be forecasted. In 2024, a significant swing low of importance is likely to occur during the low of the Ceres Declination cycle.
Ceres Declination Cycle bottoms around September 23, 2024, and begins to turn higher around October 4, 2024
August 14, 2024 – Geocentric Mars Conjunct Jupiter
August 20, 2024 – Full Moon, Moon Perigee
September 7 to September 17, 2024 – Mars Out-Of-Bounds
September 14, 2024 – 90-degree Square of 9 dates (from the 2020 Covid crash low)
Putting it all together
BTC/USD Quarterly Chart
April 2022 – July 2022
April is historically one of the best performing months for Bitcoin. If it follows historical norms, then a steady rise should be observed for the remainder of April, extending until the end of June and the beginning of July.
July 15 is most likely when the genuine conviction of selling pressure begins.
July 2022 – January 2023
Weakness and selling pressure are likely to generate a 30% to 40% drop from the all-time highs, followed by a relief rally in January 2023.
January 2023 - April 2023
The relief rally is likely to terminate between the end of April 2023 to the beginning of May 2023.
May 2023 – October 2024
The relief rally for Bitcoin price will generate some false hope, with selling pressure resuming in May 2023 and extending into the Fall of 2024. The lows of 2024 are likely to match the current median retracement percentages of 75% to 83% for Bitcoin and the entire cryptocurrency market. However, depending on institutional participation, the rate of the drawdown could be cut by a considerable amount, perhaps only between 42% and 51%.
Q2 Forecast for Bitcoin Price
A new all-time high near $100,000 or $138,000 on or before late June 2022 to mid-July 2022.
Author

Jonathan Morgan
Independent Analyst
Jonathan has been working as an Independent future, forex, and cryptocurrency trader and analyst for 8 years. He also has been writing for the past 5 years.