![]() Sheldon McIntyre, CMT
Sheldon McIntyre, CMT
Independent Analyst
- Bitcoin price still unable to reclaim the psychologically important $60,000.
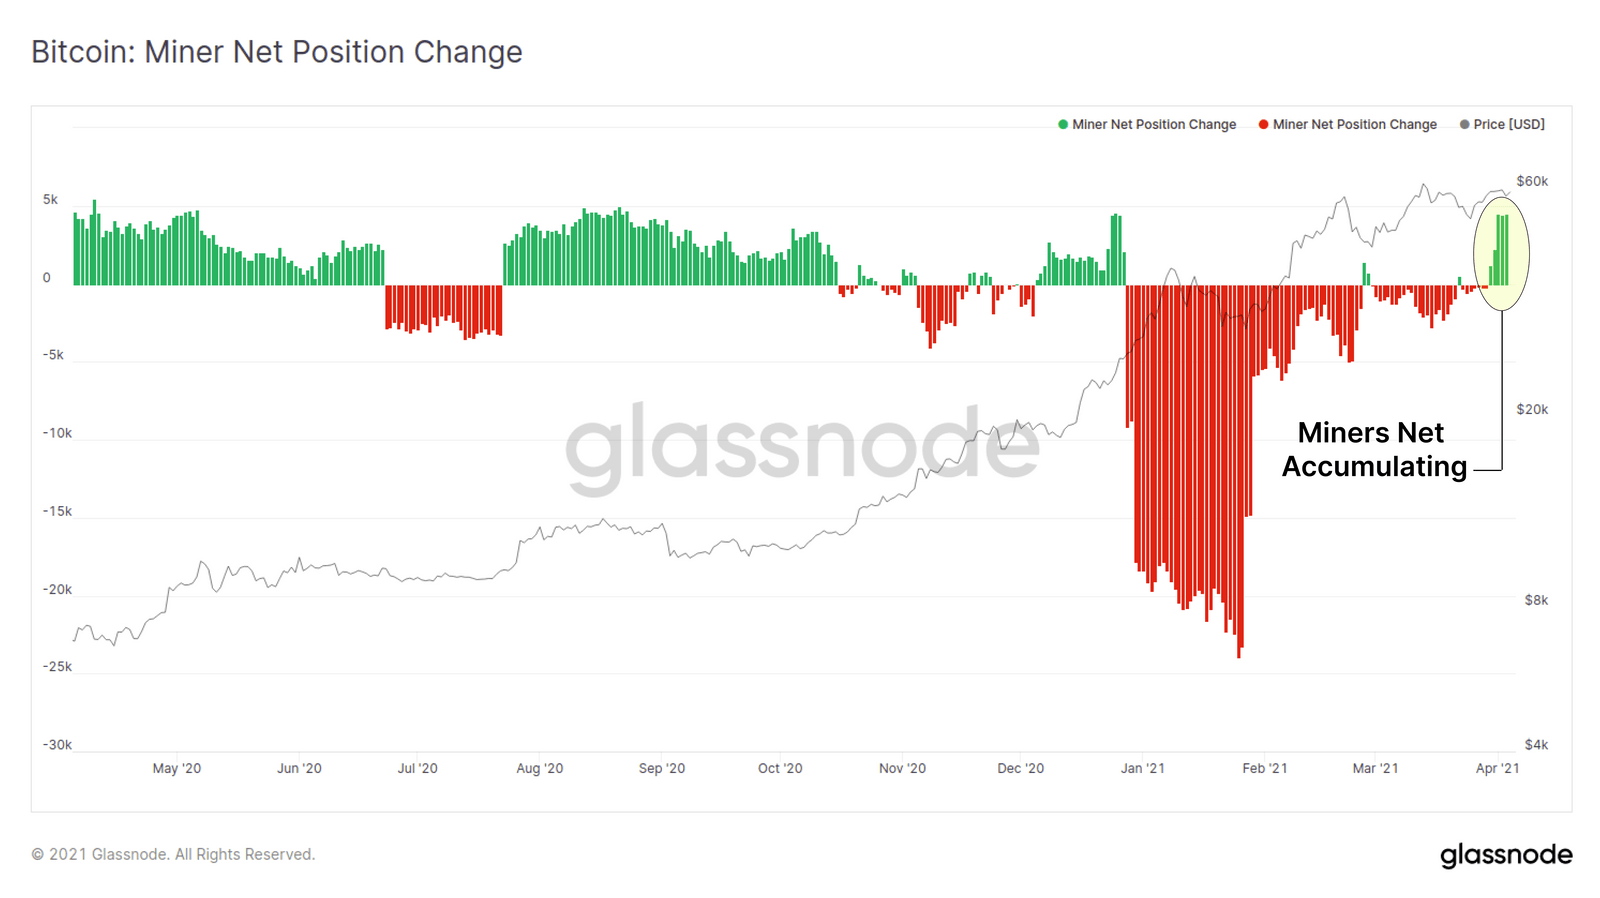
- Miners have returned to accumulation mode.
- Ascending wedge pattern projects another marginal high before reversing.
Bitcoin price has failed to close above $60,000 on a daily basis since March 13 but has been supported by the 21-day simple moving average (SMA) over the last seven days. Overall, the technical picture has tilted bearish in the short-term while the on-chain metrics are mixed. The complex picture makes it prudent to wait for the unpredictable directional movement to resolve in either direction.
Bitcoin price boxed in by underlying fundamentals
On the bullish side of the ledger, BTC miners, albeit an increasingly smaller influence as sell-side entities compared to daily trade volume, are net accumulating bitcoin at levels last seen in December 2020.
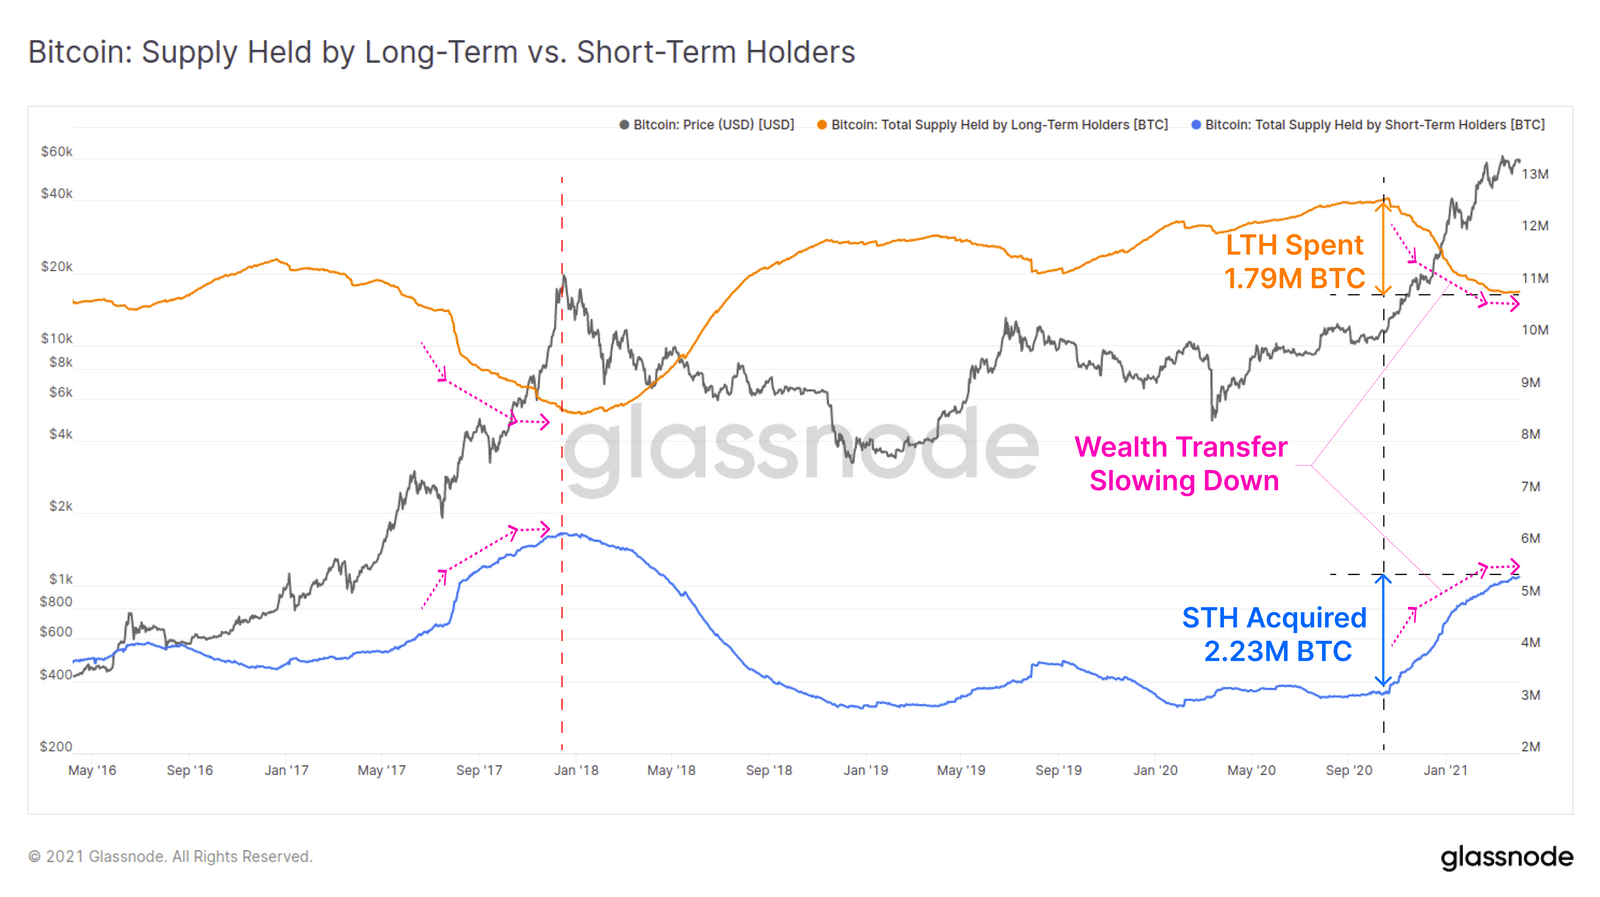
On the flipside, short-term holders have accumulated around 440k more BTC than long-term holders have spent over the previous six months, indicating a burgeoning new demand hitting the market. The problem is, this type of wealth transfer occurred at the 2017 peak.
Yes, BTC has closed above the $1 trillion market capitalization for ten consecutive days, but it has not gotten any closer to resolving the heavy resistance at $60,000. As an observation, the bellwether token has registered four daily dojis just below the psychologically important level since March 20, reflecting the balance between supply and demand.
The long-term outlook for BTC remains positive, but it is important to entertain the potential that it is forming a complex top in the short term in the form of an ascending wedge pattern.
The wedge pattern could last a few more weeks, and BTC should print at least one more marginal high before strongly reverting to the downside. Support first appears at the intersection of the 50-day SMA with the wedge’s lower trendline at $54,000, followed by the March low at $50,305.
A deeper correction puts the 100-day SMA in play at $45,057 and then the February 28 low at $43,106.
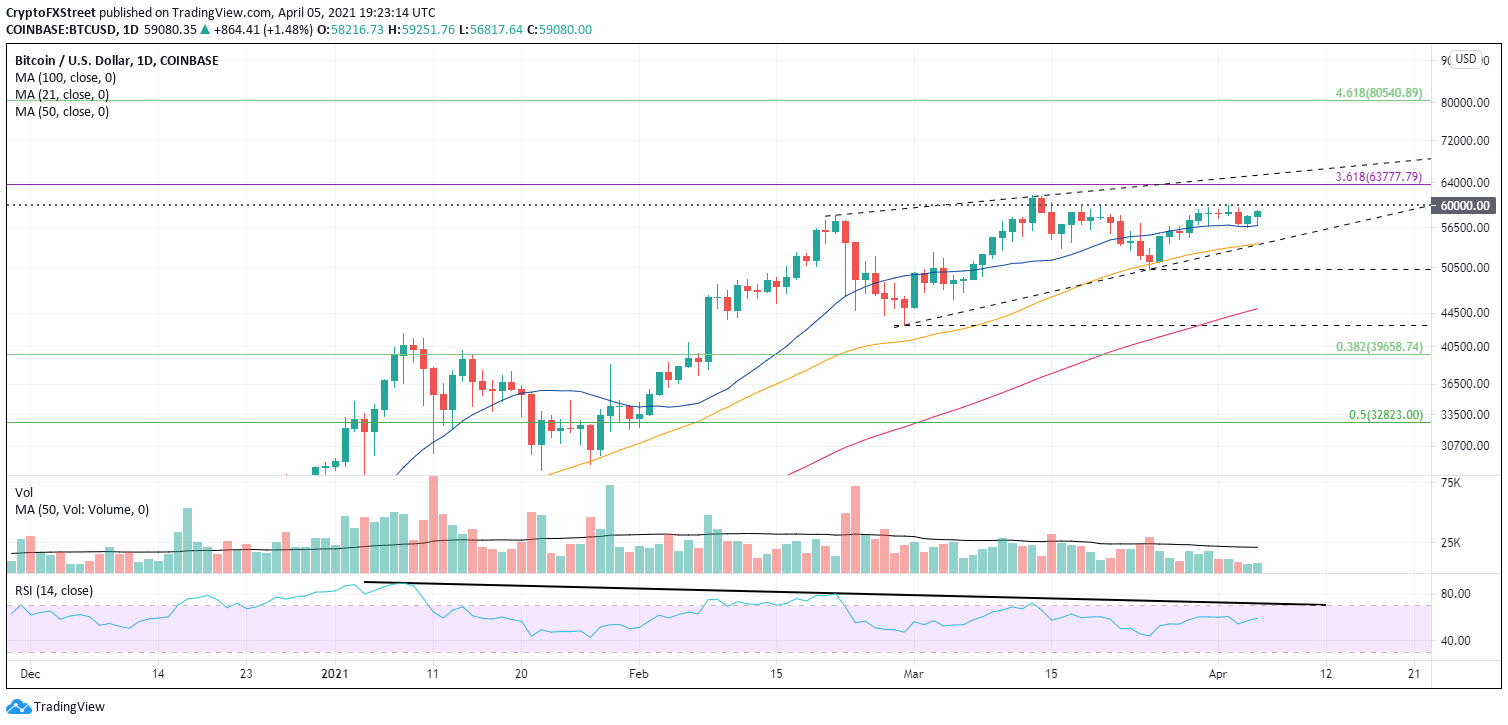
BTC/USD daily chart
A bullish resolution of the pattern would release BTC to test the 4.618 Fibonacci extension of the 2017-2018 bear market at $80,541. Higher targets would need to be evaluated after the resolution.
Over the last few weeks, adoption momentum has surpassed anything in the past, but it has not sprung BTC higher, begging the question of whether the good news is priced in.
Note: All information on this page is subject to change. The use of this website constitutes acceptance of our user agreement. Please read our privacy policy and legal disclaimer. Opinions expressed at FXstreet.com are those of the individual authors and do not necessarily represent the opinion of FXstreet.com or its management. Risk Disclosure: Trading foreign exchange on margin carries a high level of risk, and may not be suitable for all investors. The high degree of leverage can work against you as well as for you. Before deciding to invest in foreign exchange you should carefully consider your investment objectives, level of experience, and risk appetite. The possibility exists that you could sustain a loss of some or all of your initial investment and therefore you should not invest money that you cannot afford to lose. You should be aware of all the risks associated with foreign exchange trading, and seek advice from an independent financial advisor if you have any doubts.
Recommended Content
Editors’ Picks

XRP futures market signals rising bearish momentum amid large profit levels of long-term holders
Ripple's XRP declined by 1% on Tuesday, as on-chain and futures data reveal the impact of the recent market downturn on its investors.

Tron Price Forecast: TRX founder Justin Sun announces collaboration with Solana Blockchain
Tron (TRX) price edges slightly down, trading at $0.23 on Wednesday after rallying nearly 12% in the last two days.

Bitcoin not yet in a bearish phase despite on-chain and futures liquidity contraction: Glassnode
Bitcoin (BTC) traded above $81,000 on Wednesday as both its on-chain liquidity and futures open interest declined, according to Glassnode's weekly report.

Raydium plans to launch Pumpfun competitor, will this spark a meme coin war?
Solana-based decentralized exchange (DEX) Raydium is allegedly planning to roll out LaunchLab, a new token launchpad that would serve as an alternative to Pump.fun, according to a Blockworks report on Tuesday.

Bitcoin: BTC at risk of $75,000 reversal as Trump’s trade war overshadows US easing inflation
Bitcoin price remained constrained within a tight 8% channel between $76,000 and $84,472 this week. With conflicting market catalysts preventing prolonged directional swings, here are key factors that moved BTC prices this week, as well as key indicators to watch in the weeks ahead.

The Best brokers to trade EUR/USD
SPONSORED Discover the top brokers for trading EUR/USD in 2025. Our list features brokers with competitive spreads, fast execution, and powerful platforms. Whether you're a beginner or an expert, find the right partner to navigate the dynamic Forex market.