- Bitcoin price shows signs of exhaustion as it trades around the $34,000 region.
- Two sell signals on the daily time frame suggest a potential pullback.
- On-chain metrics show declining investor sentiment and a potential sell-off.
Bitcoin (BTC) price, on the daily time frame, showcases not one but multiple sell signals. To add to its woes, on-chain metrics are also showing profit-taking en masse. While the rally prompted by the potential ETF approval has propelled BTC so far, the lack thereof could also knock the pioneer crypto lower.
Read more about Fed Chairman Jerome Powell's FOMC comments and its effect on BTC - Link
Bitcoin ETF news is key for the ongoing rally
The approval of a Bitcoin spot Exchange-Traded Fund (ETF) has been a speculative event for a few years now. But lately, the ETF-related developments have been heating up. The US Securities and Exchange Commission (SEC), which approves or disapproves the ETF products, has been on the back foot after losing a string of crypto lawsuits.
The initial run-up in Bitcoin price kick-started in mid-October and was caused by the SEC losing Grayscale’s lawsuit for converting the GBTC product into spot ETF offering and other ETF-related developments. But now that there are no updates, BTC has been moving sideways.
Regardless, the speculative Bitcoin trading frenzy will mutate to a new level in January 2024, which is the next key deadline for the ETF decision. This event will make or break the crypto space. Until then, however, investors should be prepared for a retracement, especially considering that Bitcoin price has been sprouting multiple sell signals.
Bitcoin price could slide soon
Bitcoin (BTC) price rallied 30% between October 16 and 24 and set up a local top at $35,280. This move was impressive due to the massive bullish momentum. But after this swing high was formed, BTC has been moving sideways. Since October 25, the daily candlestick closes have produced an upward slope, which might seem bullish to the naked eye. A closer look at the Relative Strength Index (RSI) shows it is sloping downwards. This non-conformity is called bearish divergence and often leads to a pullback or correction.
This is the first major sell signal that investors need to notice.
Apart from the bearish divergence, the Momentum Reversal Indicator (MRI) has flashed not one but two sell signals. The first sell sign was printed after the daily candlestick close on October 23 in the form a red down arrow. Nine days later, the MRI has flashed another red down arrow. This sign forecasts a one-to-four down candlesticks.
Hence, investors could see Bitcoin price slide lower. The Fair Value Gap (FVG) area, extending from $30,248 to $32,832 and its midpoint of $31,540 are key support levels to watch.
Read more: Investors realizing profits following 32% rally might send Bitcoin price to $30,000
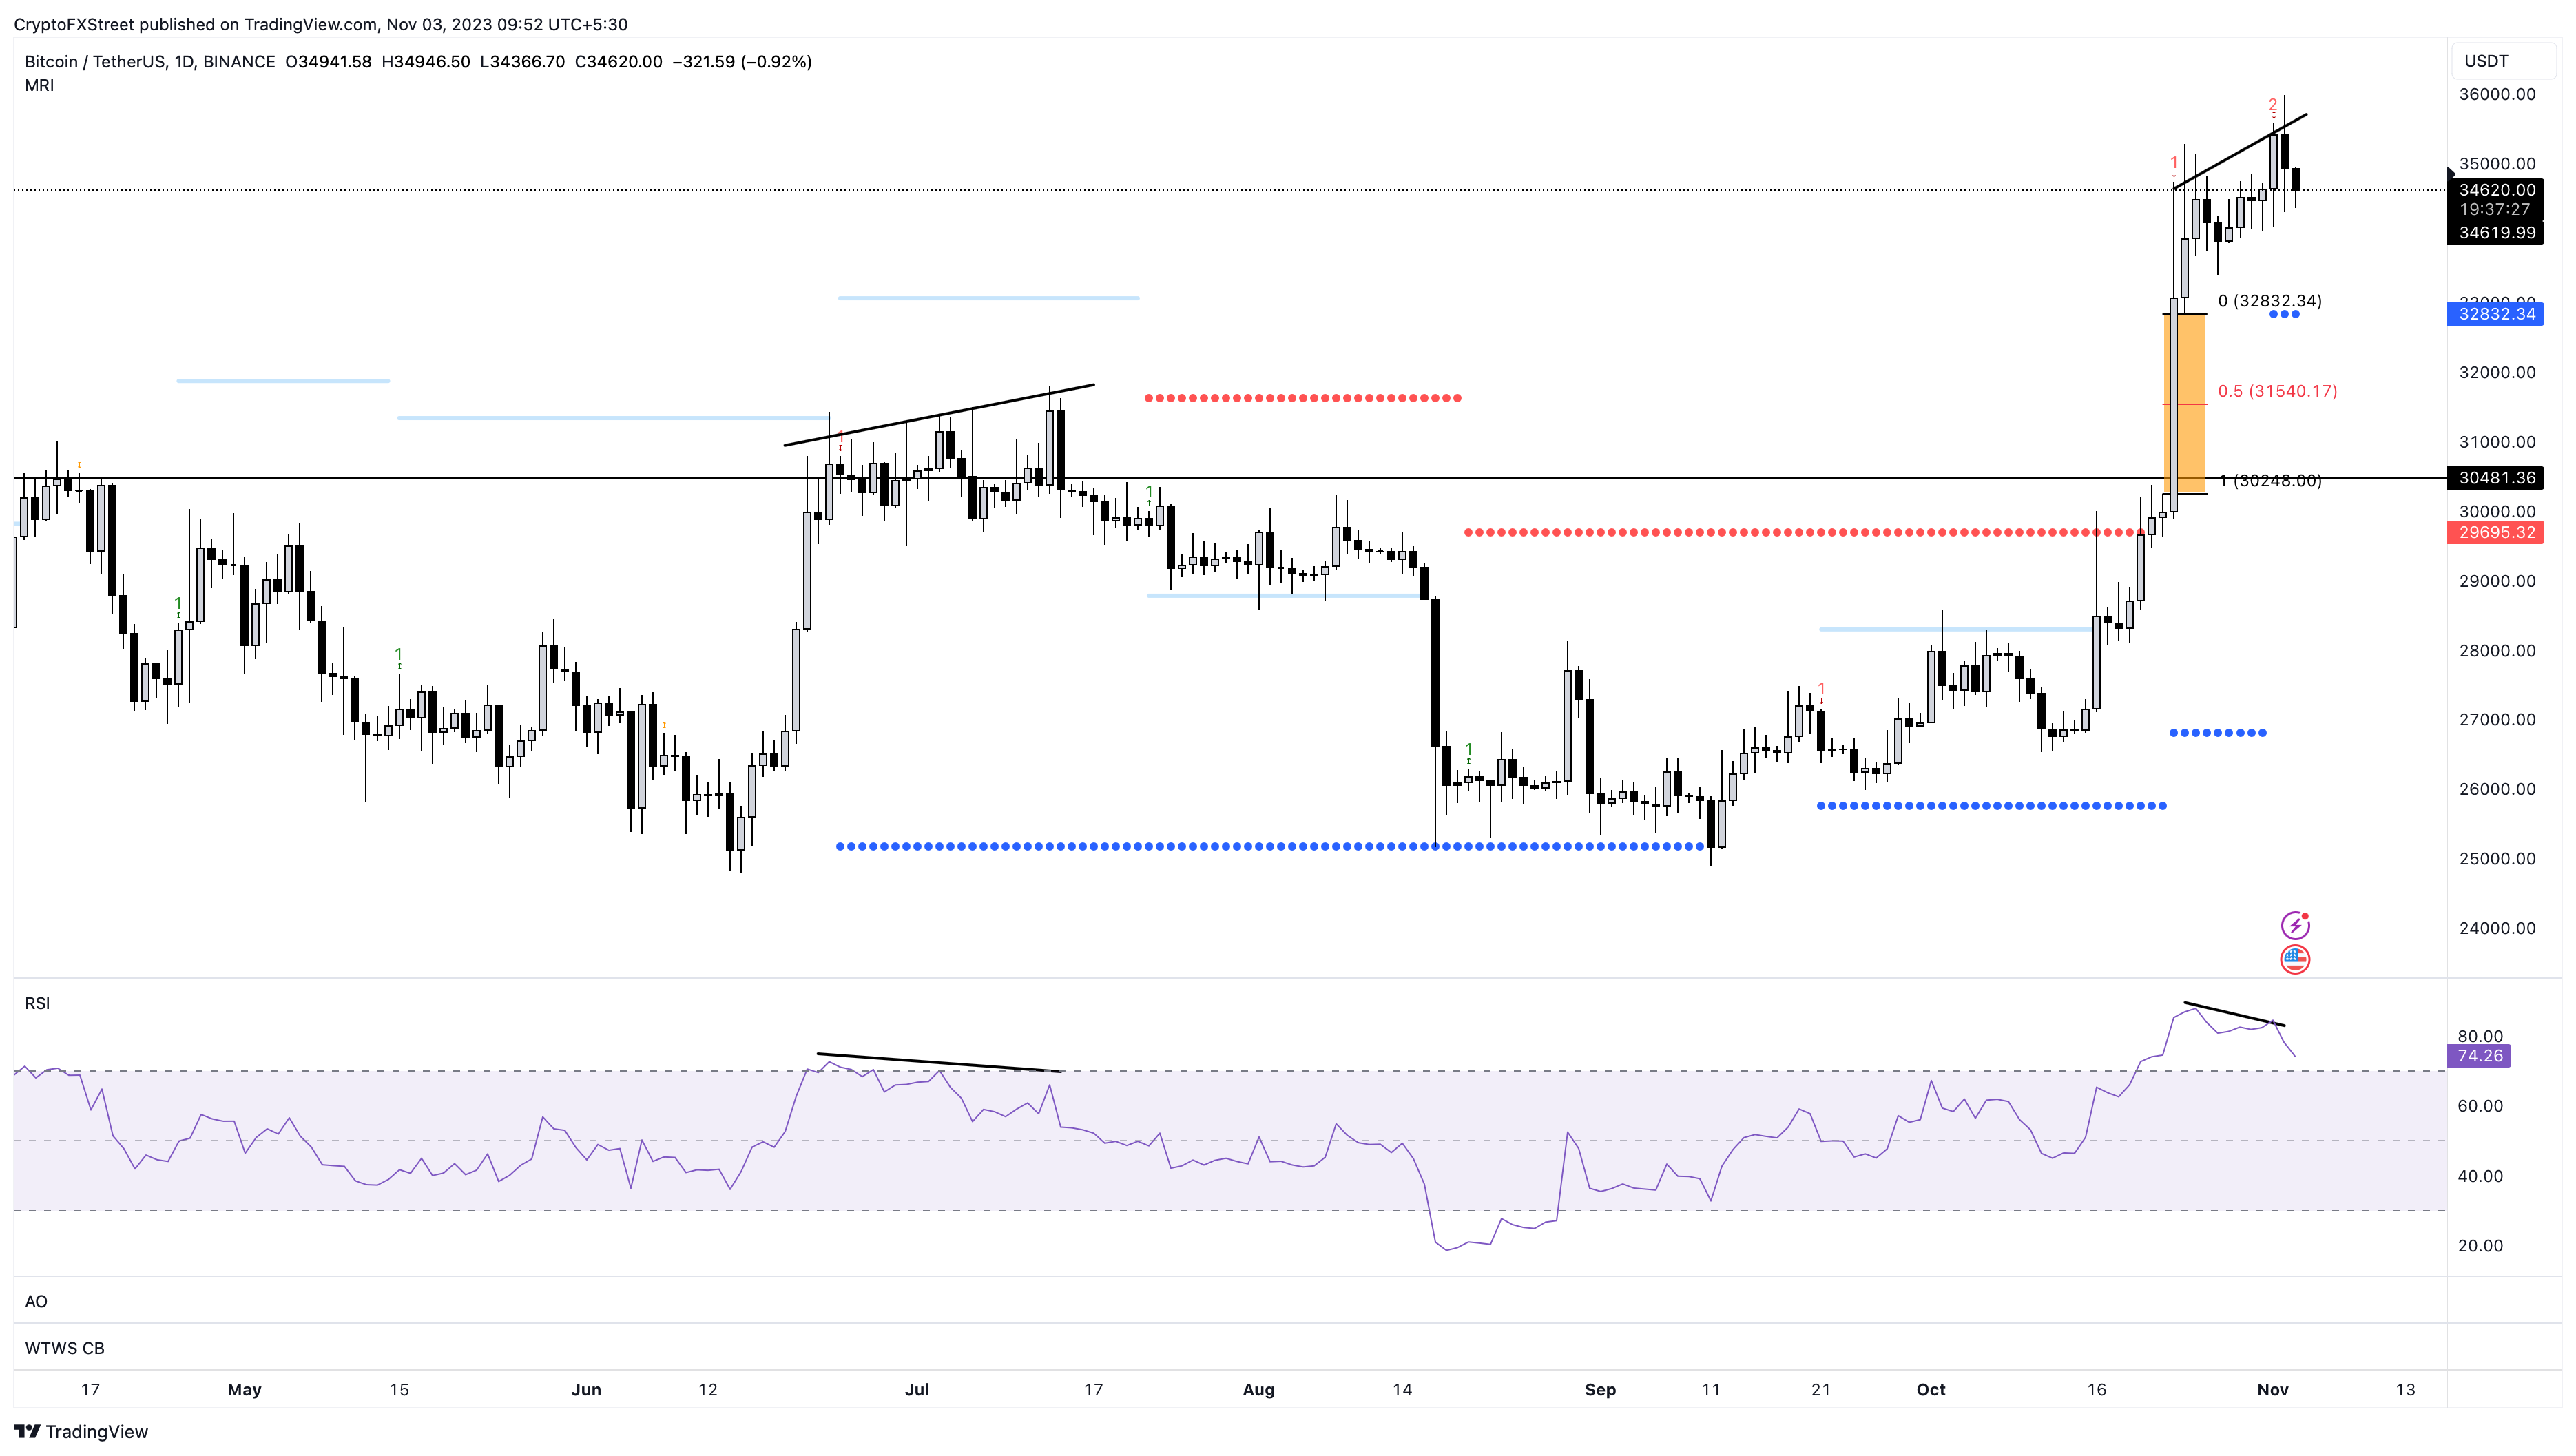
BTC/USDT 1-day chart
On-chain metrics add credence to bearish outlook
The Network Realized Profit/Loss (NPL) indicator from Santiment shows two major spikes on October 24 and 28 of $524 million and $542 million, which indicates that investors are booking profits. When similar profit-taking events occurred in July coupled with bearish divergence, Bitcoin price crashed from roughly $31,400 to $25,800.
 [09.53.28, 03 Nov, 2023]-638345833103303532.png)
BTC NPL
The same bearish outlook can be seen in Whale Transaction metric, which has been skyrocketing since October 23. A spike in this index, which tracks the transfers worth $100,000 or more, suggests whales are likely moving their holdings to book profits.
 [09.54.02, 03 Nov, 2023]-638345833301384818.png)
BTC whale transaction
The 30-day Market Value to Realized Value (MVRV) indictor is used to measure the average profit/loss of investors that purchased BTC in the past month. Currently, the MVRV is hovering around 10% after dropping from 16% on October 23. This level suggests that the average profit of investors that purchased BTC in the past month is 10%. These holders could sell to realize their profits, triggering a sell-off.
Typically, the 30-day MVRV has formed local top around 16% to 22% in the past year. Hence, this area can be termed as “Danger Zone” since it is followed by a correction in Bitcoin price.
 [09.54.11, 03 Nov, 2023]-638345833456313136.png)
BTC 30-day MVRV
Concluding thoughts
All in all, the outlook for Bitcoin price looks rather bearish, not just from a technical standpoint but also from an on-chain perspective. The only way these sell signals can be sidestepped is if there is an ETF-related development.
In such a case, Bitcoin price could tackle the $35,000 hurdle and make its way toward the $40,000 psychological level. This move would invalidate the bearish thesis.
Information on these pages contains forward-looking statements that involve risks and uncertainties. Markets and instruments profiled on this page are for informational purposes only and should not in any way come across as a recommendation to buy or sell in these assets. You should do your own thorough research before making any investment decisions. FXStreet does not in any way guarantee that this information is free from mistakes, errors, or material misstatements. It also does not guarantee that this information is of a timely nature. Investing in Open Markets involves a great deal of risk, including the loss of all or a portion of your investment, as well as emotional distress. All risks, losses and costs associated with investing, including total loss of principal, are your responsibility. The views and opinions expressed in this article are those of the authors and do not necessarily reflect the official policy or position of FXStreet nor its advertisers. The author will not be held responsible for information that is found at the end of links posted on this page.
If not otherwise explicitly mentioned in the body of the article, at the time of writing, the author has no position in any stock mentioned in this article and no business relationship with any company mentioned. The author has not received compensation for writing this article, other than from FXStreet.
FXStreet and the author do not provide personalized recommendations. The author makes no representations as to the accuracy, completeness, or suitability of this information. FXStreet and the author will not be liable for any errors, omissions or any losses, injuries or damages arising from this information and its display or use. Errors and omissions excepted.
The author and FXStreet are not registered investment advisors and nothing in this article is intended to be investment advice.
Recommended Content
Editors’ Picks

Bitcoin holds $84,000 despite Fed’s hawkish remarks and spot ETFs outflows
Bitcoin is stabilizing around $84,000 at the time of writing on Thursday after facing multiple rejections around the 200-day EMA at $85,000 since Saturday. Despite risk-off sentiment due to the hawkish remarks by the US Fed on Wednesday, BTC remains relatively stable.

Crypto market cap fell more than 18% in Q1, wiping out $633.5 billion after Trump’s inauguration top
CoinGecko’s Q1 Crypto Industry Report highlights that the total crypto market capitalization fell by 18.6% in the first quarter, wiping out $633.5 billion after topping on January 18, just a couple of days ahead of US President Donald Trump’s inauguration.

Top meme coin gainers FARTCOIN, AIDOGE, and MEW as Trump coins litmus test US SEC ethics
Cryptocurrencies have been moving in lockstep since Monday, largely reflecting sentiment across global markets as United States (US) President Donald Trump's tariffs and trade wars take on new shapes and forms each passing day.

XRP buoyant above $2 as court grants Ripple breathing space in SEC lawsuit
A US appellate court temporarily paused the SEC-Ripple case for 60 days, holding the appeal in abeyance. The SEC is expected to file a status report by June 15, signaling a potential end to the four-year legal battle.
Bitcoin Weekly Forecast: Market uncertainty lingers, Trump’s 90-day tariff pause sparks modest recovery
Bitcoin (BTC) price extends recovery to around $82,500 on Friday after dumping to a new year-to-date low of $74,508 to start the week. Market uncertainty remains high, leading to a massive shakeout, with total liquidations hitting $2.18 billion across crypto markets.

The Best brokers to trade EUR/USD
SPONSORED Discover the top brokers for trading EUR/USD in 2025. Our list features brokers with competitive spreads, fast execution, and powerful platforms. Whether you're a beginner or an expert, find the right partner to navigate the dynamic Forex market.