Bitcoin price suffers rejection but technicals remain bullish as key support holds


  • BTC/USD picks up bids above $49,000 in a move to defy pullback from record top.
  • Bullish momentum, RSI join sustained trading beyond key trend line convergence to back the upside moves.
  • 200-bar SMA adds to the downside filter, weekly support line restricts immediate declines.

BTC/USD regains above $49,000, currently near $49,320, while extending the late Tuesday’s recovery moves from the mid-$47,000s. In doing so, the crypto major eyes the record top, flashed the previous day, as earlier pullback couldn’t conquer the key support.

Also favoring the bitcoin buyers could be the strong RSI and Momentum (MOM) indicators suggesting the continuation of the uptrend.

As a result, BTC/USD bulls are currently directed towards breaking an ascending resistance line from February 09, at $50,260 now, before challenging the all-time peak around $50,600.

During the quote’s sustained run-up past-$50,600, chatters surrounding the cryptocurrency pair’s rally towards the $100,000 psychological magnet will gain momentum.

Alternatively, an upward sloping trend line from Monday, currently around $47,950, offers immediate support to the quote ahead of highlighting the confluence of a previous resistance line from January 29 and a three-week-old support line near $43,900.

It should also be noted that the 200-bar SMA level of $38,100 offers extra support during the BTC/USD downside below the stated key level for bears.

BTC/USD four-hour chart
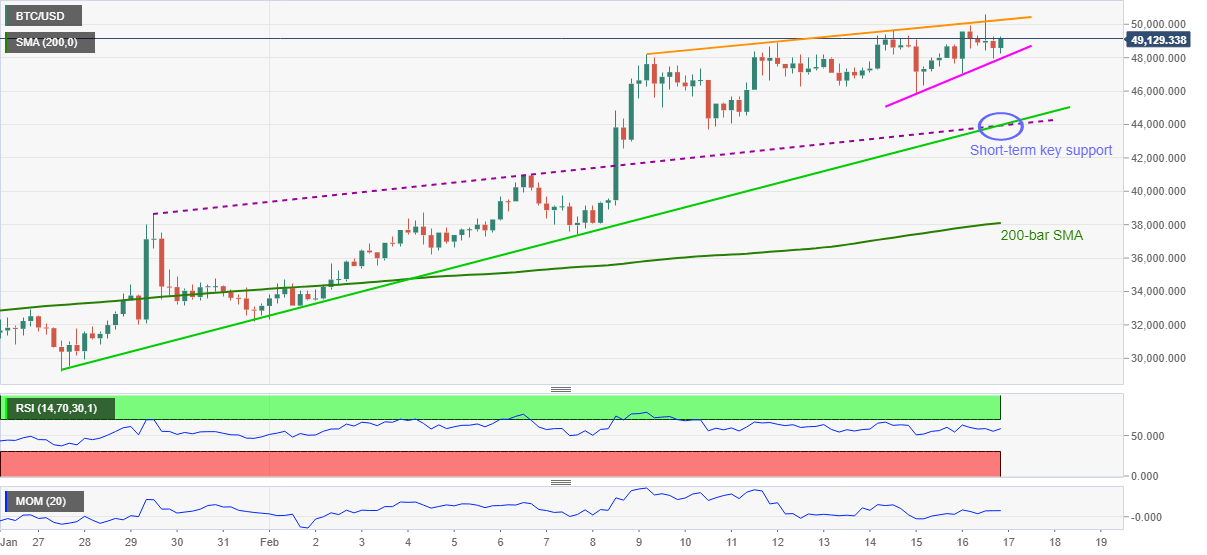
Trend: Bullish

Additional important levels

Overview
Today last price 49171.91
Today Daily Change 0.00
Today Daily Change % 0.00%
Today daily open 49171.91
 
Trends
Daily SMA20 41079.81
Daily SMA50 36983.97
Daily SMA100 28287.17
Daily SMA200 19974.97
 
Levels
Previous Daily High 50614.01
Previous Daily Low 47059.22
Previous Weekly High 48932.32
Previous Weekly Low 37390.41
Previous Monthly High 41987.21
Previous Monthly Low 27772
Daily Fibonacci 38.2% 49256.08
Daily Fibonacci 61.8% 48417.15
Daily Pivot Point S1 47282.75
Daily Pivot Point S2 45393.6
Daily Pivot Point S3 43727.97
Daily Pivot Point R1 50837.54
Daily Pivot Point R2 52503.16
Daily Pivot Point R3 54392.32


Information on these pages contains forward-looking statements that involve risks and uncertainties. Markets and instruments profiled on this page are for informational purposes only and should not in any way come across as a recommendation to buy or sell in these assets. You should do your own thorough research before making any investment decisions. FXStreet does not in any way guarantee that this information is free from mistakes, errors, or material misstatements. It also does not guarantee that this information is of a timely nature. Investing in Open Markets involves a great deal of risk, including the loss of all or a portion of your investment, as well as emotional distress. All risks, losses and costs associated with investing, including total loss of principal, are your responsibility. The views and opinions expressed in this article are those of the authors and do not necessarily reflect the official policy or position of FXStreet nor its advertisers. The author will not be held responsible for information that is found at the end of links posted on this page.

If not otherwise explicitly mentioned in the body of the article, at the time of writing, the author has no position in any stock mentioned in this article and no business relationship with any company mentioned. The author has not received compensation for writing this article, other than from FXStreet.

FXStreet and the author do not provide personalized recommendations. The author makes no representations as to the accuracy, completeness, or suitability of this information. FXStreet and the author will not be liable for any errors, omissions or any losses, injuries or damages arising from this information and its display or use. Errors and omissions excepted.

The author and FXStreet are not registered investment advisors and nothing in this article is intended to be investment advice.

Recommended content


Recommended Content

Editors’ Picks

This week could be explosive for ETH: Ethereum ETFs to debut in the US on Tuesday

This week could be explosive for ETH: Ethereum ETFs to debut in the US on Tuesday

Ethereum (ETH) is down nearly 1% on Monday as the Securities & Exchange Commission (SEC) confirmed via its website on Tuesday that it has given the final approval for spot ETH ETFs. Considering the ETH ETF launch and the upcoming Bitcoin Conference, this week could prove crucial for Ethereum.

More Ethereum News

SEC gives final approval for Ethereum ETFs to begin trading

SEC gives final approval for Ethereum ETFs to begin trading

The Securities and Exchange Commission (SEC) approved the S-1 registration statements of spot Ethereum ETF issuers on Monday, making it the second digital asset ETF to go live in the US, according to the latest filings on its website. The approval is also visible across the websites of the various asset managers that applied for the product.

More Ethereum News

Could Donald Trump and Elon Musk provide Bitcoin's bullish spark?

Could Donald Trump and Elon Musk provide Bitcoin's bullish spark?

Trump could use Justice Department's 200,000 BTC as headstart for potential Bitcoin reserve, says analyst. Elon Musk hints at potential Bitcoin endorsement after US dollar value destruction post and laser eyes profile picture. The bearish crowd has remained silent since Bitcoin's two-week rebound.

More Bitcoin News

Crypto investment products continue positive run after $1.35 billion net inflows

Crypto investment products continue positive run after $1.35 billion net inflows

CoinShares' weekly report shows that crypto investment products saw a third consecutive week of inflows. Bitcoin saw inflows of $1.27 billion, with short-bitcoin recording more outflows. Ethereum-based products outperformed Solana on year-to-date inflows.

More Cryptocurrencies News

Bitcoin: Will BTC continue its bullish momentum?

Bitcoin: Will BTC continue its bullish momentum?

Bitcoin (BTC) price increased by 5.5% this week until Friday after breaking above a descending trendline. Currently, it is trading slightly higher by 0.23% at $64,166.

Read full analysis

BTC

ETH

XRP