Bitcoin price sits on top of massive support despite US election fears
- Bitcoin price may experience high volatility due to the upcoming US presidential election.
- On-chain data shows that breaking above or below the $13,000-$14,000 range will determine where BTC is headed next.

The cryptocurrency market is expected to go through high volatility levels because of the upcoming US presidential election. Even though investors prepare for wild price movements, on-chain data shows that Bitcoin is contained within two massive supply and demand walls.
High volatility ahead of the US presidential election
While most altcoins in the cryptocurrency market have suffered massive losses, Bitcoin price rose to a new yearly high on October 31. BTC’s rally above $14,000 made headlines since its ability to act as a hedging asset during times of uncertainty resurfaced.
Many analysts have argued that a win by the Democratic party will negatively impact the stock market. The sell-off may also spill over to crypto just as it did during the market crash in mid-March. Regardless of the pessimistic views, historical data shows that Bitcoin price has recovered quickly in the previous presidential ballots.
For instance, the bellwether cryptocurrency took a 20% nosedive approximately two weeks before the election in 2012. But a few days later, it was able to bounce back and resumed its uptrend. A similar price action took place in 2016 as BTC dropped roughly 12% five days before the US election to then rebound towards higher highs.
-637399337228453313.png)
Now that the cryptocurrency market is still assessing the impact of the supply shock Bitcoin experienced after its halving, history may repeat itself.
Bitcoin price is contained between stiff support and resistance
IntoTheBlock’s “In/Out of the Money Around Price” (IOMAP) model reveals that the flagship cryptocurrency sits on top of stiff support. Based on this on-chain metric, more than 1 million addresses had previously purchased over 500,000 BTC between $13,100 and $13,500. This critical area of interest may have the ability to absorb some of the downward pressure from a potential sell-off.
But if the number of sell orders is significant enough to push Bitcoin price below this supply wall, there are two major support areas underneath it. The IOMAP cohorts show that the $12,700-$13,090 hurdle and the $11,500-$11,900 barrier may keep falling prices at bay and act as rebound zones.
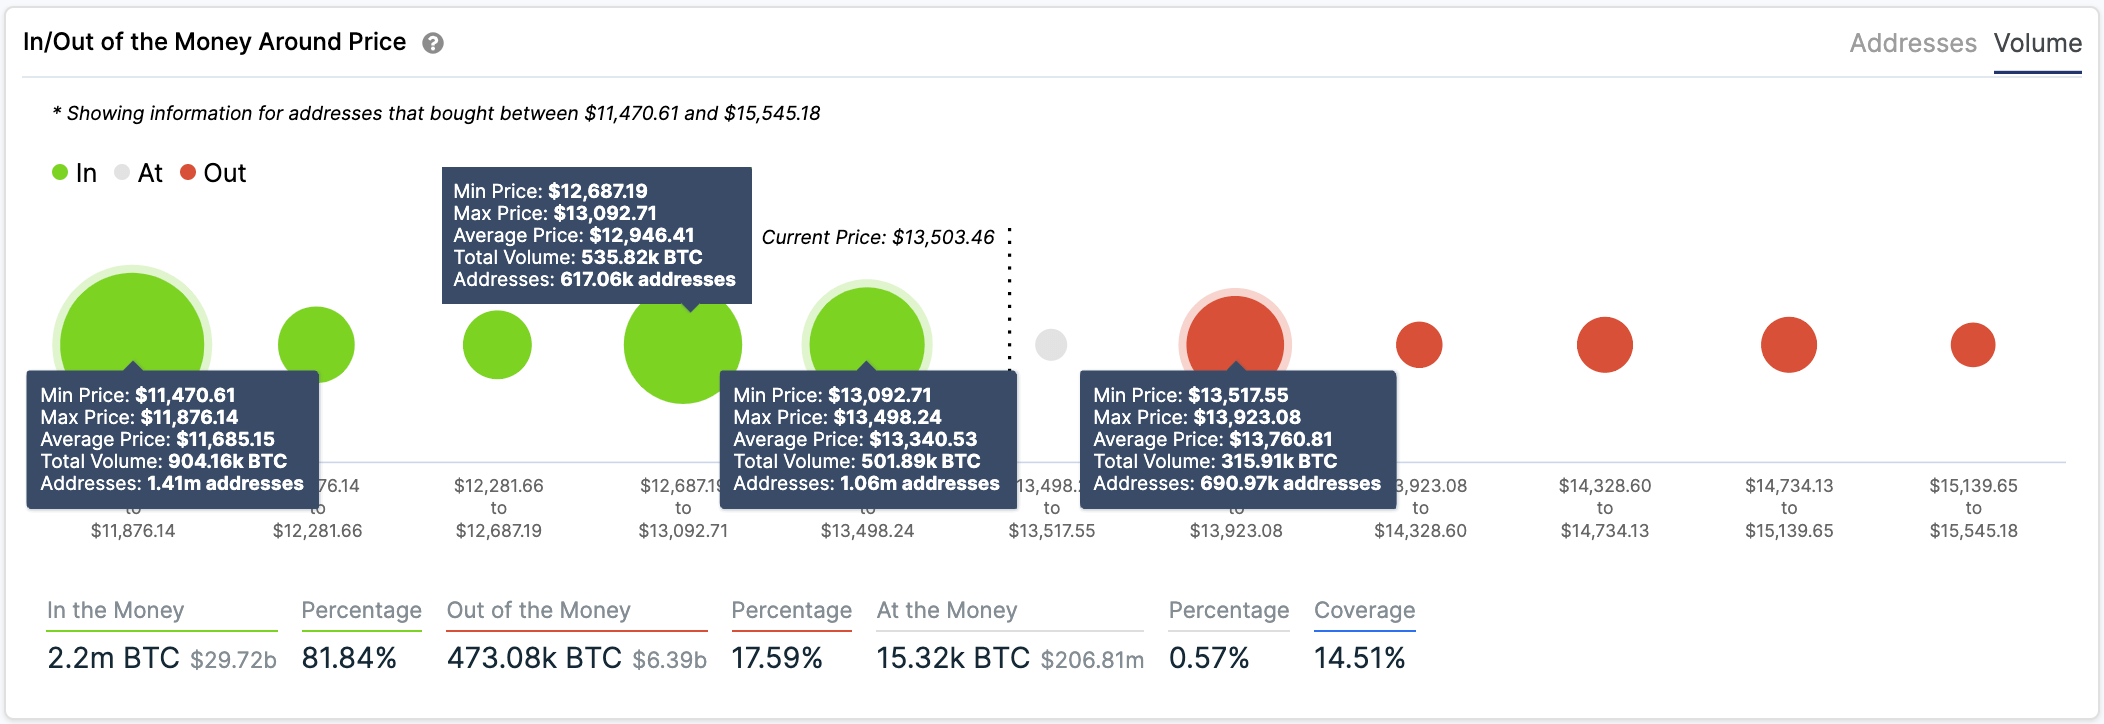
BTC In/Out of the Money Around Price
Despite the multiple support levels underneath Bitcoin, resuming the uptrend will not be easy. The IOMAP indicates that nearly 700,000 addresses bought more than 300,000 BTC between $13,520 and $13,900. Therefore, only a daily candlestick close above this resistance cluster may lead to a further advance.
Author

FXStreet Team
FXStreet


