Bitcoin price prediction: Bulls can take the price up to $8,200 if they manage to rally together
- The bulls managed to rally together towards the end of the Thursday session to make the overall day bullish.
- Currently, BTC/USD is trading for $7,800 as markets opened this Friday.

The bulls made a late comeback towards the end of Thursday, the bears gathered enough momentum to eke out the bears and end Thursday on a bullish note. During Thursday, the bears took BTC/USD down from $7,718 to $7,490 within two hours. The bulls then managed to take the price up to $7,798 as the day ended. Let’s take a look at the daily confluence detector to understand where the price may go this Friday.
BTC/USD daily confluence detector
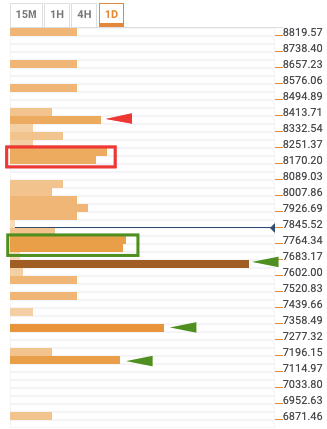
As per the daily confluence detector, the resistance levels are at $8,400 and $8,165-$8,250. The confluences at those levels are:
- $8,400: Daily Bollinger band middle curve and monthly 23.6% Fibonacci retracement level.
- $8,165-$8,250: Hourly Bollinger band upper curve, previous week low, 4-hour Bollinger band middle curve and 1-day previous high.
The support levels are at $7,700-$7,800, $7,675, $7,350 and $7,175. The confluences at those levels are:
- $7,700-$7,800: 10-day simple moving average (SMA 10), SMA 200, SMA 50, daily 23.6% Fibonacci retracement level, SMA 5, 15-min previous low and daily 38.2% Fibonacci retracement level.
- $7,675: 15-min Bollinger band lower curve, hourly Bollinger band lower curve, daily 61.8% Fibonacci retracement level and monthly 38.2% Fibonacci retracement level.
- $7,350: 1-day pivot point support 2, daily Bollinger band lower curve and 1-week pivot point support 2.
- $7,175: Daily pivot point support 3 and weekly 161.8% Fibonacci retracement level.
Author

Rajarshi Mitra
Independent Analyst
Rajarshi entered the blockchain space in 2016. He is a blockchain researcher who has worked for Blockgeeks and has done research work for several ICOs. He gets regularly invited to give talks on the blockchain technology and cryptocurrencies.


