Bitcoin Price Prediction: BTC whales sell as analysts eye “dead cat bounce”
- BTC’s recent price action has been deemed a fakeout by some prominent analysts.
- The 50-day SMA and 100-day SMA are critical levels that will determine the direction of future price movement.
- Blomberg released a report that predicts BTC to reach $100,000 by 2025.

Currently, the overall outlook surrounding Bitcoin seems extremely bullish. As we have previously reported, the buyers are aiming for the $12,000-level and beyond. LunarCRUSH, a crypto community analytics provider, registered more than 540 million BTC-related mentions across multiple social media networks, with 66% of them being bullish about Bitcoin.
Despite the upward price action that the flagship cryptocurrency is going through, some of the most prominent analysts in the space believe that everything could be part of a “fakeout” or “dead cat bounce.” Such market behavior suggests that the ongoing uptrend will be short-lived before prices are forced to drop further.
And there's the fake breakout for $BTC. We got the push up to switch people bullish and take out shorts and now we most likely head back down. pic.twitter.com/rYa8EnuMwp
— IncomeSharks (@IncomeSharks) October 8, 2020
A steep price decline before substantial gains?
As previously reported by FXStreet, the premier cryptocurrency had a bullish breakout from the symmetrical triangle on September 8. Now, the 50-day SMA ($10,850) and 100-day SMA ($10,650) play a critical role in identifying whether or not the recent price action was part of a fakeout
BTC/USD daily chart
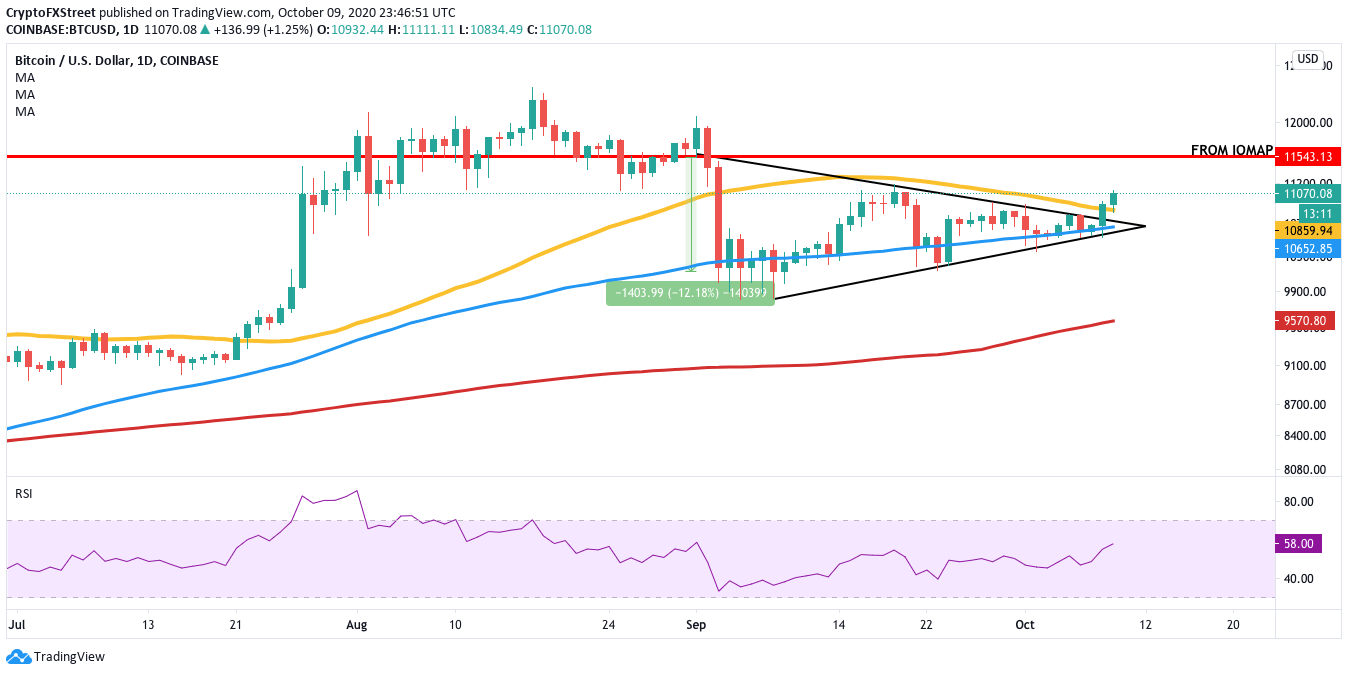
Based on IntoTheBlock’s “In/Out of the Money Around Price,” the range between these price points is, far and away, the strongest support level for BTC. The on-chain statistical model suggests that between $10,850 and $10,650 around 3.45 million addresses had purchased 2.38 million BTC.
BTC IOMAP

If BTC crumbles under intense selling pressure and breaks below these levels, then prices will likely fall all the way down to the 200-day SMA ($9,500), validating the bearish prediction. Such a pessimistic thesis holds when looking at the way Bitcoin whales have been behaving in the last 48 hours, which may hint at a spike in selling pressure.
Bitcoin holders distribution
 [05.35.56, 10 Oct, 2020]-637378897755296823.png)
Santiment, a cryptocurrency analytics platform, indicates that based on its “Holders Distribution” index the number of addresses holding 1,000 to 100,000 BTC reduced by 9 over the last 48 hours, going down by ~0.5%. This may not seem like a big number, but keep in mind that these addresses hold millions of dollars worth of BTC. So, it looks like the whales are selling off their tokens, which is a very bearish sign.
The Flipside: How can BTC strengthen the bullish narrative?
The immediate task for the buyers is very obvious, protect the 50-day SMA and 100-day SMA at all costs. As we have seen, any fall below this can be catastrophic. Plus, they should definitely make a push for the $11,600 resistance line. As per the IOMAP, this is the strongest resistance level on the upside. Clearing this will help BTC surge up to the $13,000-level.
The longterm outlook remains bullish
Bloomberg recently published a report claiming that they expect BTC to reach $100,000 by 2025. In the report, the financial media giant made the following points to support their narrative:
- Bitcoin has a habit of adding zeros: Bitcoin first reached $1,000 in 2013, it corrected by 80% and consolidated. For years later, the benchmarked cryptocurrency reached $10,000 in 2017 and then corrected by about 70% and currently remains in consolidation. Assuming normal maturation and doubling the time frame from 2013 to 2017, BTC should add another 0 and reach $100,000 eight years later in 2025.
- Increasing demand: Bitcoin has already experienced investments from large institutions like Microstrategy and Square. More institutional investments can be expected in the future.
- Limited supply: Bitcoin has a fixed supply of 21 million, of which around 90% has been mined already. Unlike other high-value assets, the total amount of BTC cannot be inflated.
Key price levels to watch
Currently, the two most important levels to watch are the 50-day SMA ($10,850) and 100-day SMA ($10,650). If these levels crumble under intense selling pressure, the flagship cryptocurrency will drop to the 200-day SMA ($9,500).
However, if the bulls come through and manage to defend these levels successfully, they will need to break BTC to turn the $11,600 resistance line into support to prevent any dangers of a pullback or fakeout. Breaking past that level will give BTC a clear path to $13,000.
Author

Rajarshi Mitra
Independent Analyst
Rajarshi entered the blockchain space in 2016. He is a blockchain researcher who has worked for Blockgeeks and has done research work for several ICOs. He gets regularly invited to give talks on the blockchain technology and cryptocurrencies.


