- Bitcoin tumbles from $10,000; finds support above $9,000 as volatility returns to the crypto market.
- BTC/USD is likely to embrace consolidation before a breakout towards $10,000 comes into play.
Bitcoin price bulls were forced to endure a painful ride towards $9,000 in the wake of Thursday’s rejection from $10,000. The ascending trendline support on the daily chart could not stop the losses. BTC/USD spiraled below earlier support at $9,600. The bearish grip increased momentum, pushing the price below some key support areas at $9,400 and $9,200. Fortunately, buyers found their balance above $9,050, marking the end of the free-fall.
At the time of writing, Bitcoin is trading at $9,371 after conquering the resistance at $9,300. Its immediate downside is supported by the 50-day SMA. The 100-day SMA currently holds the position at $8,000 and would be vital in stopping dire declines if Bitcoin tanks under $9,000. On the upside, the price is preparing to face a tougher seller congestion zone at $9,400. Gains above this zone would give Bitcoin a clear path towards $10,000.
The technical picture from the daily chart shows the possibility of consolidation taking over in spite of the drop. However, a bearish divergence with the MACD signals that selling pressure cannot be ignored. In this case, establishing support above $9,300 would play a key role in the near term recovery towards the critical $10,000.
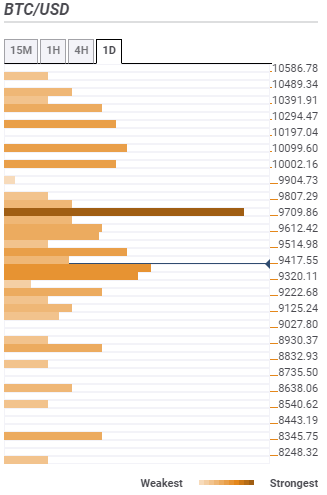
BTC/USD daily chart
-637275351173644556.png)
Bitcoin confluence resistance and support levels
Resistance one: $9,417 – The zone is highlighted by the previous high 15-minutes, the Bollinger Band 15-minutes upper curve, the SMA 200 4-hour and the previous high 4-hour.
Resistance two: $9,514 – The zone is home to the Bollinger Band one-day middle curve, the Fibonacci 38.2% one-day, SMA five 4-hour and the Bollinger Band one-hour upper curve.
Resistance three: $9,709 – This is the strongest resistance zone and is home to the Fibo 38.2% one-week, the SMA 200 1-hour, SMA 15-minutes, the Bollinger Band 4-hour middle curve and the SMA 100 1-hour among other indicators.
Support one: $9,320 – This initial support zone hosts the previous week low, the Fibo 23.6% one-day, SMA ten 1-hour, and SMA five one-hour.
Support two: $9,222 – Highlights the previous low 4-hour and the Bollinger Band 15-minutes lower curve.
Support three: $8,930 – Home to the pivot point one-day support one and the Fibo 61.8% one-month.
Information on these pages contains forward-looking statements that involve risks and uncertainties. Markets and instruments profiled on this page are for informational purposes only and should not in any way come across as a recommendation to buy or sell in these assets. You should do your own thorough research before making any investment decisions. FXStreet does not in any way guarantee that this information is free from mistakes, errors, or material misstatements. It also does not guarantee that this information is of a timely nature. Investing in Open Markets involves a great deal of risk, including the loss of all or a portion of your investment, as well as emotional distress. All risks, losses and costs associated with investing, including total loss of principal, are your responsibility. The views and opinions expressed in this article are those of the authors and do not necessarily reflect the official policy or position of FXStreet nor its advertisers. The author will not be held responsible for information that is found at the end of links posted on this page.
If not otherwise explicitly mentioned in the body of the article, at the time of writing, the author has no position in any stock mentioned in this article and no business relationship with any company mentioned. The author has not received compensation for writing this article, other than from FXStreet.
FXStreet and the author do not provide personalized recommendations. The author makes no representations as to the accuracy, completeness, or suitability of this information. FXStreet and the author will not be liable for any errors, omissions or any losses, injuries or damages arising from this information and its display or use. Errors and omissions excepted.
The author and FXStreet are not registered investment advisors and nothing in this article is intended to be investment advice.
Recommended Content
Editors’ Picks

Bitcoin edges below $84,000 as US Crypto Strategic Reserve hype fades
Bitcoin price extends its decline on Tuesday and erases its weekend gains. US President Trump’s announcement of the Crypto Strategic Reserve was turned into a short-term “buy the rumor, sell the news” event.

Cryptomarket falls as US Crypto Strategic Reserve hype fizzles into classic ‘buy the rumor, sell the news’
Bitcoin, Ethereum, Solana, Ripple and Cardano continue their declines for the second consecutive day after their recent upsurge on Sunday.

Pepe Price Forecast: PEPE bears target double-digit drop amid market weakness
Pepe price is extending its decline on Tuesday after falling more than 18% the previous day. On-chain data shows that PEPE’s daily active addresses and trading volume are falling, indicating a bearish picture.

Solana memecoins in red: Popcat and Dogwifhat shed $140M as TRUMP’s token tumbles 80% from all-time high
Solana memecoin sector valuation declined by $2 billion in 24 hours to hit $8.1 billion in early Asian trading on Tuesday. Technical indicators highlight key levels to watch as Popcat, Dogwifhat and Trump (TRUMP) emerge as the top losers.

Bitcoin: BTC bloodbath continues, near 30% down from its ATH
Bitcoin (BTC) price extends its decline and trades below $80,000 at the time of writing on Friday, falling over 15% so far this week. This price correction wiped $660 billion of market capitalization from the overall crypto market and saw $3.68 billion in total liquidations this week.

The Best brokers to trade EUR/USD
SPONSORED Discover the top brokers for trading EUR/USD in 2025. Our list features brokers with competitive spreads, fast execution, and powerful platforms. Whether you're a beginner or an expert, find the right partner to navigate the dynamic Forex market.