Bitcoin Price Prediction: BTC/USD risks return to $8,900 – Confluence Detector


  • Bitcoin struggles to hold above $9,100 (pivotal level) amid the crypto market’s widespread consolidation.
  • BTC/USD risks plunging under $9,000 in July especially if the pennant pattern’s support is broken.

Bitcoin bulls are working around the clock to escape the bear traps between $9,000 and $9,200. Gains heading to $9,200 have become unsustainable while support at $9,100 is not strong enough to guarantee the aversion of losses to $9,000.

Meanwhile, BTC is trading at $9,133 as it battles the resistance at the 50 SMA. On the downside, the initial support is the 100 SMA aided by an ascending trendline (part of the bearish pennant pattern).

It is essential that the price holds above $9,100 because that will allow bulls to focus on $9,200. However, if losses come into the picture and pennant support is shattered, BTC/USD could plunge below $9,000 and even test the recent support at $8,900.

From a different technical angle, the ongoing consolidation could last longer based on the signals from the RSI and the MACD. Both indicators are moving sideways at their respective midlines. The RSI is horizontal at 50 (average) while the MACD at 0.00 (midline). If they remain in the same condition longer, consolidation would also last longer.

BTC/USD 1-hour chart

BTC/USD price chart

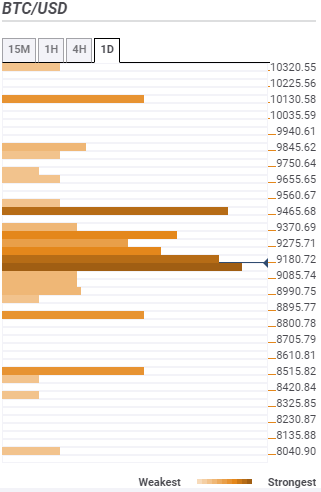
Bitcoin confluence support and resistance levels

Resistance one: $9,180 – This is a region that converges a cluster of indicators such as the SMA 50 1-hour, SMA five 15-minutes, the previous high 15-minutes, previous high 1-hour, the Bollinger band 1-hour middle and the SMA 50 15-minutes.

Resistance two: $9,275 – Home to the Fibo 161.8% one-day, Fibo 38.2% one-week, SMA 100 4-hour, the Bollinger Band one-day middle curve and the pivot point daily resistance three.

Resistance three: $9,465 – This is the region that brings together the SMA 50 daily, the Fibo, SMA 200 4-hour and the Fibo 61.8% one-week.

Support one: $9,085 – Highlighted by the previous low one-day and the pivot point one-day support one.

Support two: $8,895 – Is a region that hosts the previous month low and the pivot point one-week support one.

Support three: $8,515 – Highlighted by the pivot point one-month support one and the pivot point one-week support two.

fxsoriginal


Information on these pages contains forward-looking statements that involve risks and uncertainties. Markets and instruments profiled on this page are for informational purposes only and should not in any way come across as a recommendation to buy or sell in these assets. You should do your own thorough research before making any investment decisions. FXStreet does not in any way guarantee that this information is free from mistakes, errors, or material misstatements. It also does not guarantee that this information is of a timely nature. Investing in Open Markets involves a great deal of risk, including the loss of all or a portion of your investment, as well as emotional distress. All risks, losses and costs associated with investing, including total loss of principal, are your responsibility. The views and opinions expressed in this article are those of the authors and do not necessarily reflect the official policy or position of FXStreet nor its advertisers. The author will not be held responsible for information that is found at the end of links posted on this page.

If not otherwise explicitly mentioned in the body of the article, at the time of writing, the author has no position in any stock mentioned in this article and no business relationship with any company mentioned. The author has not received compensation for writing this article, other than from FXStreet.

FXStreet and the author do not provide personalized recommendations. The author makes no representations as to the accuracy, completeness, or suitability of this information. FXStreet and the author will not be liable for any errors, omissions or any losses, injuries or damages arising from this information and its display or use. Errors and omissions excepted.

The author and FXStreet are not registered investment advisors and nothing in this article is intended to be investment advice.

Join Telegram

Recommended content


Recommended Content

Editors’ Picks

Ripple on-chain metrics show bullish signs amidst legal struggle with SEC, XRP eyes recovery

Ripple on-chain metrics show bullish signs amidst legal struggle with SEC, XRP eyes recovery

Ripple made a comeback above $0.48 on Tuesday and hovers above that level in Wednesday’s European session. Ripple on-chain metrics such as transaction volume and Network Realized Profit/Loss have turned bullish, supporting a recovery in the altcoin. 

More Ripple News

Bitcoin price falls amidst German government transfers, miners activity

Bitcoin price falls amidst German government transfers, miners activity

Bitcoin (BTC) extends correction on Wednesday and hovers around $61,000 after finding resistance near the $64,000 level on Monday. Recent on-chain data indicates heightened selling activity from Bitcoin miners early in the week. 

More Bitcoin News

Crypto Today: Bitcoin erases gains from end of June, Ethereum declines while Ripple holds

Crypto Today: Bitcoin erases gains from end of June, Ethereum declines while Ripple holds

Bitcoin wipes out gains from the last week of June and falls below $60,000 on Wednesday. Ethereum and top altcoins ranked by market capitalization erased gains as the inflation outlook worsened. Ripple holds on to recent gains and hovers above $0.48 on Wednesday. 

More Cryptocurrencies News

Three reasons why altcoins could shake off losses this week

Three reasons why altcoins could shake off losses this week

On-chain data from Santiment shows that altcoins are currently in the opportunity zone, or generating buy signals. The top three altcoins in the buy zone are Basic Attention Token (BAT), Chromia (CHR), and Highstreet (HIGH), per Santiment. 

More Altcoins News

Bitcoin: BTC price correction could end in July, according to seasonal data

Bitcoin: BTC price correction could end in July, according to seasonal data

Bitcoin (BTC) price appears poised for a decline this week, influenced by slight outflows in US spot ETFs, selling activity among BTC miners, and a combined transfer of 4,690.28 BTC to centralized exchanges by the US and German governments.

Read full analysis

BTC

ETH

XRP