- Bitcoin price stalls under $11,400 following a retest of the primary support at $11,100.
- BTC/USD reversal to $12,000 is still possible but it’s best to wait for a confirmed breakout above the key trendline.
Bitcoin bulls are working hard to hold the price above short term support at $11,300. For the second time in less than a week, Bitcoin has tested support at $11,100. The second fall followed the most recent rejection at $11,500. Buyers managed to create some volume that saw Bitcoin make an immediate reversal from $11,000 but it was not been enough to sustain gains towards $11,500 let alone break the next hurdle at $11,400.
The 4-hour chart shows the big wick bearish candle (red) that gave way for an instant pullback from the support at $11,100. However, with the resistance at $11,400 intact, traders should wait for a confirmation before betting on Bitcoin’s ability to hit $12,000 in the coming weekend session.
Meanwhile technical indicators clearly show that consolidation is bound to take over. The RSI is holding horizontally at 45 after a gradual but steady recovery from levels closer to the oversold. The MACD is, however, stuck in the negative region, which highlights the fact that selling pressure is present. Therefore, bulls should be aware in order to plan to keep Bitcoin above $11,300 and focus on the path towards $12,000.
A break above the descending trendline would add gasoline to the fire ignited by the bulls. Bitcoin would then be rocketed above multiple resistance zones highlighted at $11,600, $11,800 and the ultimate $12,000.
BTC/USD 4-hour chart
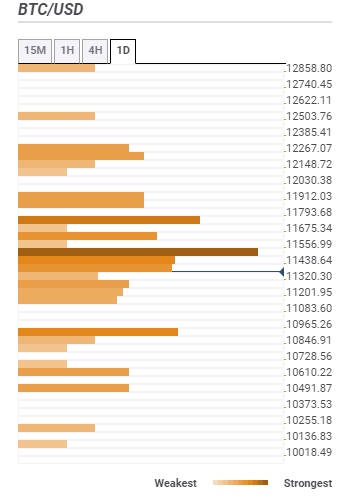
Bitcoin confluence levels
Resistance one: $11,438 – This seller congestion zone is home to a cluster of indicators including the previous high 1-hour, the Bollinger Band 15-minutes upper, the Fibonacci 61.8% one-day and the SMA ten 4-hour among others.
Resistance two: $11,556 – As highlighted by the Bollinger Band 1-hour upper, the previous month high, the SMA 200 4-hiur and the previous week high.
Support one: $11,320 – A medium strong support that that hosts the previous low 4-hour, the Fibo 38.2% one-day and the SMA 15-minutes.
Support two: $11,201 – Home to the Bollinger Band 4-hour lower curve and the pivot point one-week support one.
Information on these pages contains forward-looking statements that involve risks and uncertainties. Markets and instruments profiled on this page are for informational purposes only and should not in any way come across as a recommendation to buy or sell in these assets. You should do your own thorough research before making any investment decisions. FXStreet does not in any way guarantee that this information is free from mistakes, errors, or material misstatements. It also does not guarantee that this information is of a timely nature. Investing in Open Markets involves a great deal of risk, including the loss of all or a portion of your investment, as well as emotional distress. All risks, losses and costs associated with investing, including total loss of principal, are your responsibility. The views and opinions expressed in this article are those of the authors and do not necessarily reflect the official policy or position of FXStreet nor its advertisers. The author will not be held responsible for information that is found at the end of links posted on this page.
If not otherwise explicitly mentioned in the body of the article, at the time of writing, the author has no position in any stock mentioned in this article and no business relationship with any company mentioned. The author has not received compensation for writing this article, other than from FXStreet.
FXStreet and the author do not provide personalized recommendations. The author makes no representations as to the accuracy, completeness, or suitability of this information. FXStreet and the author will not be liable for any errors, omissions or any losses, injuries or damages arising from this information and its display or use. Errors and omissions excepted.
The author and FXStreet are not registered investment advisors and nothing in this article is intended to be investment advice.
Recommended Content
Editors’ Picks

Ethereum Price Forecast: ETH consolidates below $2,000 as Standard Chartered alters its prediction for 2025
Ethereum remained just below $2,000 in the Asian session on Tuesday as Standard Chartered's Global Head of Digital Assets Research, Geoffrey Kendrick, updated the bank's 2025 price forecast for ETH.

Solana price faces 50-day resistance as SOL futures debut on CME Group with $5M volume on fifth anniversary
Solana (SOL) stagnated around the $128 mark on Monday despite multiple bullish catalysts. The recent SOL unlocks by Alameda Research, ahead of FTX creditor repayments, have created a persistent bearish overhang since early March.

Canary Capital proposes first-ever Sui ETF following S-1 filing with the SEC
SUI saw slight gains on Monday as Canary Capital submitted an S-1 application with the Securities & Exchange Commission (SEC) to launch a Sui exchange-traded fund (ETF). This adds to the growing list of altcoin ETF filings awaiting approvals from the regulator.

Outflows in crypto funds reach $6.4 billion over five weeks amid long-term holder accumulation
Crypto exchange-traded funds (ETFs) extended their outflow streak last week, totaling $1.7 billion, bringing the total outflows in the past 5 weeks to $6.4 billion, per CoinShares weekly report on Monday.

Bitcoin: BTC at risk of $75,000 reversal as Trump’s trade war overshadows US easing inflation
Bitcoin price remained constrained within a tight 8% channel between $76,000 and $84,472 this week. With conflicting market catalysts preventing prolonged directional swings, here are key factors that moved BTC prices this week, as well as key indicators to watch in the weeks ahead.

The Best brokers to trade EUR/USD
SPONSORED Discover the top brokers for trading EUR/USD in 2025. Our list features brokers with competitive spreads, fast execution, and powerful platforms. Whether you're a beginner or an expert, find the right partner to navigate the dynamic Forex market.