- Bitcoin price clings to newfound support at $11,800; eyes glued on $12,000 as the weekend is ushered in.
- BTC/USD could settle for consolidation on Friday due to low trading volume.
Bitcoin bulls are trying to make a persuasive move above $11,800. The bullish attempt comes after recovery from levels slightly above $11,600. Looking a few days back, BTC spiked incredibly and even touched $12,500 on Coinbase and other exchange platforms. However, buyers started to lose lift as bears pulled the throttle back, at some point completely pushing the bulls out of the ‘cockpit.’ This led to losses under $12,000, but support above $11,600 came in hand.
At the moment, Bitcoin is exchanging hands at $11,872 as buyers work hard to ensure that the momentum towards $12,000 is not lost. The path to $12,000 has proved to be an uphill task since Bitcoin bounced off support at $11,600. Moreover, more resistance is highlighted by a confluence formed by the 100 SMA in the 1-hour chart and the 38.2% Fibonacci retracement level taken from the last swing high to $12,500 to a swing low at $11,620.
On the downside, initial support is provided by the 50 SMA in conjunction with 23.6% Fibo. Technically, consolidation is expected to take precedence ahead of the weekend session. This sideways trading is stressed by the RSI as it glides horizontally at 50 (midline) and the MACD’s as it clings to the mean line (0.00).
BTC/USD 1-hour chart
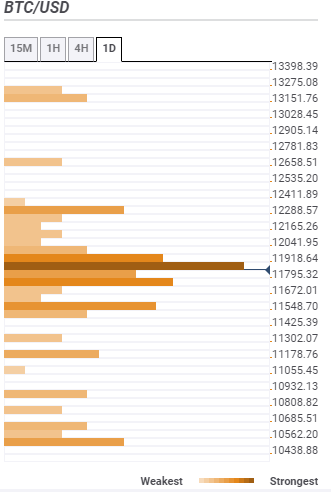
Bitcoin confluence resistance and support levels
Resistance one: $11,918 – As highlighted by the pivot point one-day resistance one, the SMA 100 1-hour and the SMA five one-day.
Resistance two: $12,288 – This zone holds the pivot point one-month resistance one and the Bollinger Band one-day upper curve.
Resistance three: $13,151 – Highlighted by the pivot point one-month resistance three and the pivot point one-week resistance three.
Support one: $11,795 – This the strongest confluence support. It is home to the SMA 100 15-minutes, the Fibo 38.2% one-day, the Bollinger Band 1-hour middle, the Bollinger Band 15-minutes middle and the Fibo 23.6% one-day.
Support two: $11548 – As highlighted by the Fibo 61.8% one-week, the pivot point one-day support three, the Bollinger Band 4-hour upper and the Fibo 161.8% one-day.
Support three: $11,178 – Home to the previous week low and the Bollinger Band one-day lower.
Information on these pages contains forward-looking statements that involve risks and uncertainties. Markets and instruments profiled on this page are for informational purposes only and should not in any way come across as a recommendation to buy or sell in these assets. You should do your own thorough research before making any investment decisions. FXStreet does not in any way guarantee that this information is free from mistakes, errors, or material misstatements. It also does not guarantee that this information is of a timely nature. Investing in Open Markets involves a great deal of risk, including the loss of all or a portion of your investment, as well as emotional distress. All risks, losses and costs associated with investing, including total loss of principal, are your responsibility. The views and opinions expressed in this article are those of the authors and do not necessarily reflect the official policy or position of FXStreet nor its advertisers. The author will not be held responsible for information that is found at the end of links posted on this page.
If not otherwise explicitly mentioned in the body of the article, at the time of writing, the author has no position in any stock mentioned in this article and no business relationship with any company mentioned. The author has not received compensation for writing this article, other than from FXStreet.
FXStreet and the author do not provide personalized recommendations. The author makes no representations as to the accuracy, completeness, or suitability of this information. FXStreet and the author will not be liable for any errors, omissions or any losses, injuries or damages arising from this information and its display or use. Errors and omissions excepted.
The author and FXStreet are not registered investment advisors and nothing in this article is intended to be investment advice.
Recommended Content
Editors’ Picks
Bitcoin Weekly Forecast: BTC bloodbath continues, near 30% down from its ATH
Bitcoin price extends its decline and trades below $80,000 at the time of writing on Friday, falling over 15% so far this week. This price correction wiped $660 billion of market capitalization from the overall crypto market and saw $3.68 billion in total liquidations this week.
Cardano poised for double-digit drop amid market weakness
Cardano price is extending its decline by nearly 7%, trading around $0.60 on Friday after falling 23% this week. Santiment data support this decline as ADA daily active addresses are falling, and the technical outlook indicates a continued correction, with ADA potentially facing an additional double-digit decline.
XRP short-term holders dominate sell-off as whales buy the dip
XRP short-term holders dominated the selling activity during the recent market crash. XRP whales have been accumulating more tokens during the crash, adding over $1 billion worth of tokens. XRP could bounce off the lower boundary of a descending channel if it fails to hold the $1.96 support level.
Top 3 Price Prediction Bitcoin, Ethereum, Ripple: BTC, ETH and XRP continue to sell off
Bitcoin (BTC) price continues declining on Friday after falling more than 15% this week. Ethereum (ETH) and Ripple (XRP) followed BTC’s footsteps and declined by nearly 24% and 21%, respectively.
Bitcoin: BTC bloodbath continues, near 30% down from its ATH
Bitcoin (BTC) price extends its decline and trades below $80,000 at the time of writing on Friday, falling over 15% so far this week. This price correction wiped $660 billion of market capitalization from the overall crypto market and saw $3.68 billion in total liquidations this week.
The Best brokers to trade EUR/USD
SPONSORED Discover the top brokers for trading EUR/USD in 2025. Our list features brokers with competitive spreads, fast execution, and powerful platforms. Whether you're a beginner or an expert, find the right partner to navigate the dynamic Forex market.