- Bitcoin managed to hold support at $11,000 after losing traction and slumping sharply.
- BTC/USD recovery has stalled short of $11,400 as more buyers stay in the sideline unsure of the uptrend.
Bitcoin was forced back to the drawing board with the bearish leg drawing closer to $11,000. Note that, the price prediction on Tuesday talked about Bitcoin likelihood of falling to $11,000 before making another attempt at crossing above the psychological $12,000.
BTC/USD explored levels around $11,000 towards the end of the American session. Recovery from the support has been slow. BTC/USD stepped above $11,300 but the resistance at $11,400 is still intact.
The largest cryptocurrency is exchanging hands at $11,388 at the time of writing. The RSI appears to be have established support at the midline. However, reversal has been delayed to emphasize that selling pressure is present in the market.
This means that the remaining part of the journey to $12,000 would be an uphill task. However, if Bitcoin brings down the seller congestion at $11,400 and $11,600, more buyers are bound to join the market in order to capitalize on the anticipated spike above $12,000.
The MACD illustrates the same picture especially with a bearish divergence under it. In addition, it is yet to recovery from the downward momentum from highs around 607.
BTC/USD daily chart
 (26)-637340189399290928.png)
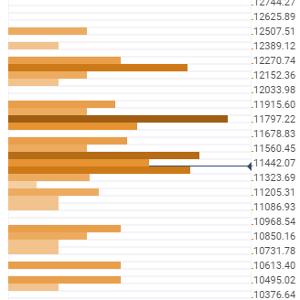
Bitcoin confluence levels
Resistance one: $11,441 – A significant resistance zone with a cluster indicators including the previous high 15-minuntes, the Bollinger Band one-hour middle, the previous high 1-hour, the previous high 4-hour and the Bollinger Band 15-minutes.
Resistance two: $11,797 – Home to the SMA 200 1-hour, the Bollinger Band one-day middle, the SMA 100 4-hour, the previous high one-day and the SMA ten one-day.
Resistance three: $11,915 – As highlighted by the Fibonacci 38.2% one-week and the Bollinger Band 4-hour upper curve.
Support one: $11,323 – A subtle support areas hosting the Fibo 23.6% one-day, the Bollinger band 15-minutes lower curve and the BB 4-hour lower curve.
Support two: $11,205 – Hosts the Bollinger Band 1-hour lower curve and the pivot point one-week support one.
Support three: $10,968 – As highlighted by the Fibonacci 23.6% one-minute.
Information on these pages contains forward-looking statements that involve risks and uncertainties. Markets and instruments profiled on this page are for informational purposes only and should not in any way come across as a recommendation to buy or sell in these assets. You should do your own thorough research before making any investment decisions. FXStreet does not in any way guarantee that this information is free from mistakes, errors, or material misstatements. It also does not guarantee that this information is of a timely nature. Investing in Open Markets involves a great deal of risk, including the loss of all or a portion of your investment, as well as emotional distress. All risks, losses and costs associated with investing, including total loss of principal, are your responsibility. The views and opinions expressed in this article are those of the authors and do not necessarily reflect the official policy or position of FXStreet nor its advertisers. The author will not be held responsible for information that is found at the end of links posted on this page.
If not otherwise explicitly mentioned in the body of the article, at the time of writing, the author has no position in any stock mentioned in this article and no business relationship with any company mentioned. The author has not received compensation for writing this article, other than from FXStreet.
FXStreet and the author do not provide personalized recommendations. The author makes no representations as to the accuracy, completeness, or suitability of this information. FXStreet and the author will not be liable for any errors, omissions or any losses, injuries or damages arising from this information and its display or use. Errors and omissions excepted.
The author and FXStreet are not registered investment advisors and nothing in this article is intended to be investment advice.
Recommended Content
Editors’ Picks

Crypto Today: BNB, OKB, BGB tokens rally as BTC, Shiba Inu and Chainlink lead market rebound
Cryptocurrencies sector rose by 0.13% in early European trading on Friday, adding $352 million in aggregate valuation. With BNB, OKB and BGB attracting demand amid intense market volatility, the exchange-based native tokens sector added $1.9 billion.

US SEC may declare XRP a 'commodity' as Ripple settlement talks begins
The US SEC is considering declaring XRP as a commodity in the ongoing settlement talks with Ripple Labs. FOX News reports suggest Ethereum's regulatory status remains a key reference for XRP’s litigation verdict.

Cardano Price Prediction: ADA could hit $0.50 despite high probability of US Fed rate pause
Cardano price stabilized above $0.70 after posting another 5% decline in its 3rd consecutive losing day. Multiple ADA derivatives trading signals are leaning bullish, but the US trade war impact outweighs the positive shift in inflation indices.
Stablecoin regulatory bill receives green light during Banking Committee hearing
The US Senate Banking Committee voted on Thursday to advance the Guiding and Establishing National Innovation for US Stablecoins (GENIUS) Act, which aims to establish proper regulations for stablecoin payments in the country.

Bitcoin: BTC at risk of $75,000 reversal as Trump’s trade war overshadows US easing inflation
Bitcoin price remained constrained within a tight 8% channel between $76,000 and $84,472 this week. With conflicting market catalysts preventing prolonged directional swings, here are key factors that moved BTC prices this week, as well as key indicators to watch in the weeks ahead.

The Best brokers to trade EUR/USD
SPONSORED Discover the top brokers for trading EUR/USD in 2025. Our list features brokers with competitive spreads, fast execution, and powerful platforms. Whether you're a beginner or an expert, find the right partner to navigate the dynamic Forex market.