- Bitcoin price spiraling towards $9,200 support after $9,400 and $9,300 caved in.
- The formed H&S pattern is Bitcoin’s remaining ticket to $10,000 but where is the volume?
Bitcoin price continues to suffer under the strong arm of the bears. The rejection from $9,600 seems unstoppable until Bitcoin returns to $9,000. Thursday’s support above $9,400 failed to hold, leaving a gap that has been explored by the bears. Bitcoin has slipped under $9,300 (the Asian session support). At the moment, the largest cryptocurrency by market capitalization is trading at $9,270.
The 1-hour chart shows Bitcoin trading under the moving averages. The 100 SMA is holding the position at $9,394 while the 50 SMA is currently at $9,415. The dive under $9,300 is likely to have rejuvenated the seller’s energy because Bitcoin continues to fall towards $9,200.
The inverse head and shoulders bullish scenario
Although the bulls in the market are enduring yet another battering this week, hope is not lost. The formation of the head and shoulders (H&S) pattern as observed from the chart shows that Bitcoin could soon reverse the trend massively towards $10,000. H&S pattern is usually useful in technical analysis to predict reversals from downtrends. In this case, a bounce is expected at $9,200, leading towards the psychological $10,000.
BTC/USD 1-hour chart
-637281351119525277.png)
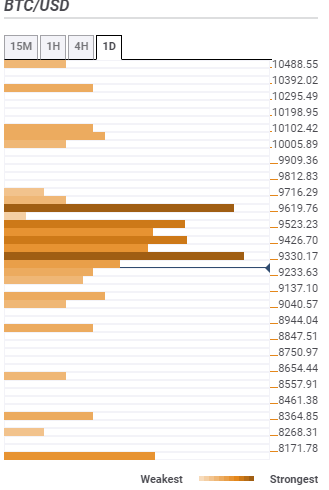
Bitcoin daily confluence resistance and support levels
Resistance one: $9,330 – Highlighted by the Fibonacci 23.6% one-week, the previous high 15-minutes, the Bollinger Band 1-hour lower, Bollinger Band 4-hour lower curve and the Fibo 23.6% one-day.
Resistance two: $9,426 – The selling pressure in this zone is highlighted by the Bollinger Band 1-hour middle curve, the SMA 100 1-hour, SMA 100 15-minutes, the previous high 4-hour, and the 61.8% one-day.
Resistance three: $9,619.76 – This zone is home to the SMA 100 4-hour, the Bollinger Band 1-day middle curve, and the Fibo 161.8% one-day.
Support one: $9,233 – Highlighted by the previous low 1-hour, previous low 15-minutes, previous low one-day, and the pivot point one-day support one.
Support two: $9,137 – The zone where the pivot point daily support and the previous week low converge.
Support three: $8,944 – Highlighted by the Fibonacci 61.8% one month.
Information on these pages contains forward-looking statements that involve risks and uncertainties. Markets and instruments profiled on this page are for informational purposes only and should not in any way come across as a recommendation to buy or sell in these assets. You should do your own thorough research before making any investment decisions. FXStreet does not in any way guarantee that this information is free from mistakes, errors, or material misstatements. It also does not guarantee that this information is of a timely nature. Investing in Open Markets involves a great deal of risk, including the loss of all or a portion of your investment, as well as emotional distress. All risks, losses and costs associated with investing, including total loss of principal, are your responsibility. The views and opinions expressed in this article are those of the authors and do not necessarily reflect the official policy or position of FXStreet nor its advertisers. The author will not be held responsible for information that is found at the end of links posted on this page.
If not otherwise explicitly mentioned in the body of the article, at the time of writing, the author has no position in any stock mentioned in this article and no business relationship with any company mentioned. The author has not received compensation for writing this article, other than from FXStreet.
FXStreet and the author do not provide personalized recommendations. The author makes no representations as to the accuracy, completeness, or suitability of this information. FXStreet and the author will not be liable for any errors, omissions or any losses, injuries or damages arising from this information and its display or use. Errors and omissions excepted.
The author and FXStreet are not registered investment advisors and nothing in this article is intended to be investment advice.
Recommended Content
Editors’ Picks

Lukas Enzersdorfer-Konrad, Bitpanda deputy CEO: “Crypto needs Gary Gensler gone”
Lukas Enzersdorfer-Konrad is the deputy CEO at Bitpanda, a broker based in Europe with more than five million users. At the European Blockchain Convention held in Barcelona, the executive shared with FXStreet his views on the current state of the crypto industry and its regulation.

Bitcoin still consolidates despite positive spot ETFs demand
Bitcoin (BTC) trades slightly up, around $64,000 on Thursday, following a rejection from the upper consolidation level of $64,700 the previous day. BTC’s price has been consolidating between $62,000 and $64,700 for the past week.

Why is ONDO’s price outlook bullish?
DefiLlama data shows that Ondo TVL reached a new ATH of $613.75 million. Ondo’s Supply Distribution metric shows whale accumulation. On-chain data shows that ONDO’s daily trading volume is rising, and the supply of exchanges is decreasing.

Maker price eyes a rally on technicals and on-chain metrics
Maker trades above $1,500 on Thursday, suggesting a potential rally as technical indicators show bullish divergence. This positive outlook is reinforced by MKR’s Exchange Flow Balance, which shows a negative spike, indicating growing investor confidence in the platform.
Bitcoin: Fed-led rally could have legs towards $65,000
Bitcoin is poised for a second consecutive week of gains, supported by the recent 50-basis-point cut in interest rates by the Federal Reserve. Bitcoin broke above several key technical resistances this week, signaling a rally continuation.

Five best Forex brokers in 2024
VERIFIED Choosing the best Forex broker in 2024 requires careful consideration of certain essential factors. With the wide array of options available, it is crucial to find a broker that aligns with your trading style, experience level, and financial goals.