- Bitcoin stalls under $9,200 but SalsaTekila, a pseudonymous analyst believes BTC/USD is heading to $13,000.
- BTC/USD could settle for consolidation based on the short term technical picture.
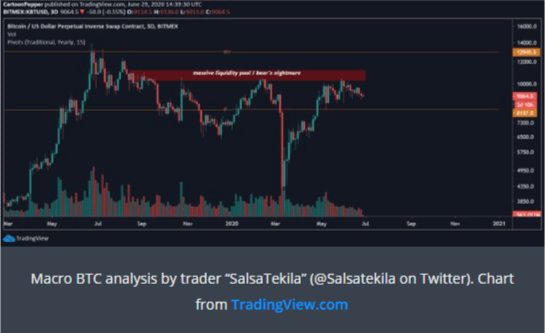
Bitcoin alongside other cryptocurrencies continues to encounter gruesome days. To many, the largest cryptocurrency has no fighting power left to rise above $10,000. However, there are some analysts who are choosing to remain bullish like the pseudonymous SalsaTekila. The analyst says that Bitcoin is “heading towards $13K mid-term. Massive liquidity pool around 10.5k, price tends to visit those sooner or later.”
Bitcoin technical picture
Bitcoin is trading at $9,168 at the time of writing. On the upside, $9,200 is the initial but key resistance. Note that, recovery from levels explored under $9,000 last week failed to sustain gains above $9,300. More hurdles are expected at $9,400, $9,500 and $9,600.
In addition, the price is trading below the 50-day SMA. Gains above this moving average could eventually catapult Bitcoin above $9,500; a move that could help shift the focus back to $10,000. On the flip side, support is expected at the former pivotal level $9,100. The buyer congestion at $9,100 is also in line to prevent losses into the $8,000’s range. If push comes to shove and BTC/USD spirals towards $8,000, the 200-day SMA ($8,483.35) could come in handy.
Technically, Bitcoin is entering into consolidation according to the RSI. The indicators is currently leveling at 48 after a minor recovery from levels around 40. The MACD also emphasizes that sideways trading would take precedence in the coming sessions. However, the MACD is in the negative region and features a small bearish divergence. In other words, sellers seem to have the upper hand. For now, keeping the price above $9,100 would give the bulls a chance to fight for $9,200.
BTC/USD daily chart
Bitcoin confluence resistance and support areas
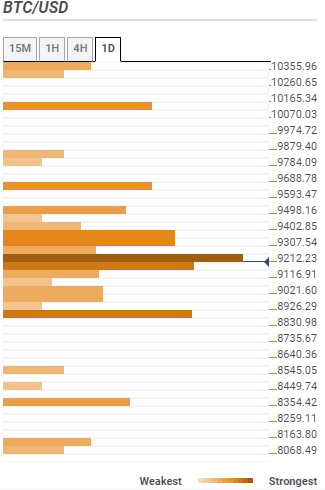
Resistance one: $9,212 – This zone is home to the Bollinger Band 1-hour upper, the previous high 4-hour, previous high one-day and the Bollinger Band 4-hour upper.
Resistance two: $9,402 – The seller congestion zone is highlighted by the pivot one-day resistance two, the Bollinger Band one-day middle curve, the Fibo 38.2% one-month and the 100 SMA 4-hour.
Resistance three: 9,688 – This zone hosts the Fibo 23.36% one-month and the pivot one-week resistance one.
Support one: $9,116 – This buyer congestion zone highlights the SMA 200 15-minutes, the Bollinger Band 4-hour middle, the Fibo 61.8% one-day and the SMA ten 4-hour.
Support two: $8,926 – This confluence is formed by the pivot point one-week support one, the pivot point daily support three and the Fibo 61.8% one-month.
Support three: $8,354 – This zone is home to the SMA 200 daily and the pivot point one-month support one.
Information on these pages contains forward-looking statements that involve risks and uncertainties. Markets and instruments profiled on this page are for informational purposes only and should not in any way come across as a recommendation to buy or sell in these assets. You should do your own thorough research before making any investment decisions. FXStreet does not in any way guarantee that this information is free from mistakes, errors, or material misstatements. It also does not guarantee that this information is of a timely nature. Investing in Open Markets involves a great deal of risk, including the loss of all or a portion of your investment, as well as emotional distress. All risks, losses and costs associated with investing, including total loss of principal, are your responsibility. The views and opinions expressed in this article are those of the authors and do not necessarily reflect the official policy or position of FXStreet nor its advertisers. The author will not be held responsible for information that is found at the end of links posted on this page.
If not otherwise explicitly mentioned in the body of the article, at the time of writing, the author has no position in any stock mentioned in this article and no business relationship with any company mentioned. The author has not received compensation for writing this article, other than from FXStreet.
FXStreet and the author do not provide personalized recommendations. The author makes no representations as to the accuracy, completeness, or suitability of this information. FXStreet and the author will not be liable for any errors, omissions or any losses, injuries or damages arising from this information and its display or use. Errors and omissions excepted.
The author and FXStreet are not registered investment advisors and nothing in this article is intended to be investment advice.
Recommended Content
Editors’ Picks

Bitcoin holds $84,000 despite Fed’s hawkish remarks and spot ETFs outflows
Bitcoin is stabilizing around $84,000 at the time of writing on Thursday after facing multiple rejections around the 200-day EMA at $85,000 since Saturday. Despite risk-off sentiment due to the hawkish remarks by the US Fed on Wednesday, BTC remains relatively stable.

Crypto market cap fell more than 18% in Q1, wiping out $633.5 billion after Trump’s inauguration top
CoinGecko’s Q1 Crypto Industry Report highlights that the total crypto market capitalization fell by 18.6% in the first quarter, wiping out $633.5 billion after topping on January 18, just a couple of days ahead of US President Donald Trump’s inauguration.

Top meme coin gainers FARTCOIN, AIDOGE, and MEW as Trump coins litmus test US SEC ethics
Cryptocurrencies have been moving in lockstep since Monday, largely reflecting sentiment across global markets as United States (US) President Donald Trump's tariffs and trade wars take on new shapes and forms each passing day.

XRP buoyant above $2 as court grants Ripple breathing space in SEC lawsuit
A US appellate court temporarily paused the SEC-Ripple case for 60 days, holding the appeal in abeyance. The SEC is expected to file a status report by June 15, signaling a potential end to the four-year legal battle.

Bitcoin Weekly Forecast: Market uncertainty lingers, Trump’s 90-day tariff pause sparks modest recovery
Bitcoin (BTC) price extends recovery to around $82,500 on Friday after dumping to a new year-to-date low of $74,508 to start the week. Market uncertainty remains high, leading to a massive shakeout, with total liquidations hitting $2.18 billion across crypto markets.

The Best brokers to trade EUR/USD
SPONSORED Discover the top brokers for trading EUR/USD in 2025. Our list features brokers with competitive spreads, fast execution, and powerful platforms. Whether you're a beginner or an expert, find the right partner to navigate the dynamic Forex market.