- Bitcoin price continues with this week’s winning streak towards $10,000.
- BTC/USD technical picture highlights possible consolidation above $9,500.
Bitcoin price kicked most of the tough resistance zones into the rearview on Wednesday. The return of volatility is finally directing attention back to Bitcoin after weeks of little to no price action.
The recovery that started on Tuesday this week saw Bitcoin initially take down the hurdle at $9,300. It briefly stepped above $9,400 but could not sustain gains to $9,500. After taking a breather, BTC/USD broke out again during the American session on Wednesday. This time, bulls were armed with enough momentum to penetrate the hurdles at $9,400 as well as $9,500.
The bullish leg extended towards $9,600 but the price retreated before the seller congestion at the area was overcome. In the meantime, Bitcoin is trading at $9,510 after advancing from the intraday low at $9,488. On the upside, an intraday high has been traded at $9,550 (short term resistance). The prevailing trend is, however, bullish which means that buyers are still relatively in control. On the flip side, the low volatility at the moment hints that price actions will be drab and limited in the near term.
The daily chart shows Bitcoin holding way above the 50-day SMA. This level gave bulls a hard time during recovery but will now function as support in the event BTC/USD reverses. Glancing forward, consolidation is likely to take over in the short term as seen with the MACD’s position slightly above the midline. It is essential to pay attention to the developing bearish grip as seen with the gradually retreating RSI.
Related reading: Ethereum Classic Market Update: ETC/USD unable to build momentum to $7.00
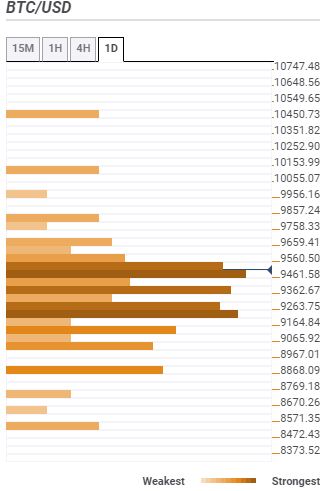
BTC/USD daily chart
 (3)-637310759248871937.png)
Bitcoin confluence resistance and support areas
Resistance one: $9,560 – This is the strongest resistance Bitcoin is dealing with at the moment. Highlighting it are the previous high 15-minutes, previous high 1-hour, the Fibonacci 161.8% one-week, the SMA five 1-hour and SMA ten 15-minutes.
Resistance two: $9,659 – Is home to the pivot point one-day resistance one and the pivot point one-week resistance three.
Resistance three: $9,857 – The seller congestion zone is brought to light by the Fibonacci 61.8% one-month.
Support one: $9,461 – The first of many support areas where a cluster of indicators converge. Some of them include the 38.2% Fibo one-month, the SMA 50 15-minutes, the SMA ten 1-hour and the Fibo 38.2% one-day.
Support two: $9,362 – Is home to the pivot point one-week resistance one, the previous week high, the SMA 50 1-hour, SMA 200 15-minutes and the pivot point one-day support one.
Support three: $9,263 – Hosts the Fibo 61.8% one-week, the Bollinger Band 1-hour lower, the SMA 100 4-hour and the SMA 200 4-hour among other indicators.
Information on these pages contains forward-looking statements that involve risks and uncertainties. Markets and instruments profiled on this page are for informational purposes only and should not in any way come across as a recommendation to buy or sell in these assets. You should do your own thorough research before making any investment decisions. FXStreet does not in any way guarantee that this information is free from mistakes, errors, or material misstatements. It also does not guarantee that this information is of a timely nature. Investing in Open Markets involves a great deal of risk, including the loss of all or a portion of your investment, as well as emotional distress. All risks, losses and costs associated with investing, including total loss of principal, are your responsibility. The views and opinions expressed in this article are those of the authors and do not necessarily reflect the official policy or position of FXStreet nor its advertisers. The author will not be held responsible for information that is found at the end of links posted on this page.
If not otherwise explicitly mentioned in the body of the article, at the time of writing, the author has no position in any stock mentioned in this article and no business relationship with any company mentioned. The author has not received compensation for writing this article, other than from FXStreet.
FXStreet and the author do not provide personalized recommendations. The author makes no representations as to the accuracy, completeness, or suitability of this information. FXStreet and the author will not be liable for any errors, omissions or any losses, injuries or damages arising from this information and its display or use. Errors and omissions excepted.
The author and FXStreet are not registered investment advisors and nothing in this article is intended to be investment advice.
Recommended Content
Editors’ Picks

Shiba Inu eyes positive returns in April as SHIB price inches towards $0.000015
Shiba Inu's on-chain metrics reveal robust adoption, as addresses with balances surge to 1.4 million. Shiba Inu's returns stand at a solid 14.4% so far in April, poised to snap a three-month bearish trend from earlier this year.

AI tokens TAO, FET, AI16Z surge despite NVIDIA excluding crypto-related projects from its Inception program
AI tokens, including Bittensor and Artificial Superintelligence Alliance, climbed this week, with ai16z still extending gains at the time of writing on Friday. The uptick in prices of AI tokens reflects a broader bullish sentiment across the cryptocurrency market.

Bitcoin Weekly Forecast: BTC consolidates after posting over 10% weekly surge
Bitcoin price is consolidating around $94,000 at the time of writing on Friday, holding onto the recent 10% increase seen earlier this week. This week’s rally was supported by strong institutional demand, as US spot ETFs recorded a total inflow of $2.68 billion until Thursday.

XRP price could renew 25% breakout bid on surging institutional and retail adoption
Ripple price consolidates, trading at $2.18 at the time of writing on Friday, following mid-week gains to $2.30. The rejection from this weekly high led to the price of XRP dropping to the previous day’s low at $2.11, followed by a minor reversal.
Bitcoin Weekly Forecast: BTC consolidates after posting over 10% weekly surge
Bitcoin (BTC) price is consolidating around $94,000 at the time of writing on Friday, holding onto the recent 10% increase seen earlier this week.

The Best brokers to trade EUR/USD
SPONSORED Discover the top brokers for trading EUR/USD in 2025. Our list features brokers with competitive spreads, fast execution, and powerful platforms. Whether you're a beginner or an expert, find the right partner to navigate the dynamic Forex market.