Bitcoin Price Prediction: BTC rebounds from crucial support, as the battle for $20,000 intensifies
- Bitcoin prepares for a return trip above $19,000 while investors are hopeful they will bag $20,000.
- Bitcoin is strongly supported based on the IOMAP model, an on-chain metric provided by IntoTheBlock.

Bitcoin recently hit a wall at $19,600 after correcting from the support provided at $18,200. Stability dominated the BTC market this week, but the flagship cryptocurrency dived under $19,000 as the weekend was ushered in. For now, Bitcoin bulls are focused on reclaiming the ground above $19,000 and pushing for gains to $20,000.
Bitcoin bounces off critical support as buyers flock back
Bitcoin bulls seemed exhausted by the unsuccessful fight to sustain gains above $19,500 this week. Many buyers retreated to the sidelines, perhaps to wait for a confirmed breakout. Sellers took advantage and increased their orders, forcing BTC to dive to the confluence support offered by the 50 Simple Moving Average and the 100 SMA on the hour chart.
At the time of writing, Bitcoin is trading at $18,930 amid the firm push by the bulls to have BTC above $19,000. The Relative Strength Index has reinforced the bullish outlook as it reverses above the midline. Trading beyond $19,000 is likely to push Bitcoin to $19,500 and $20,000 as buy orders surge.
%20(78)-637427534759589313.png)
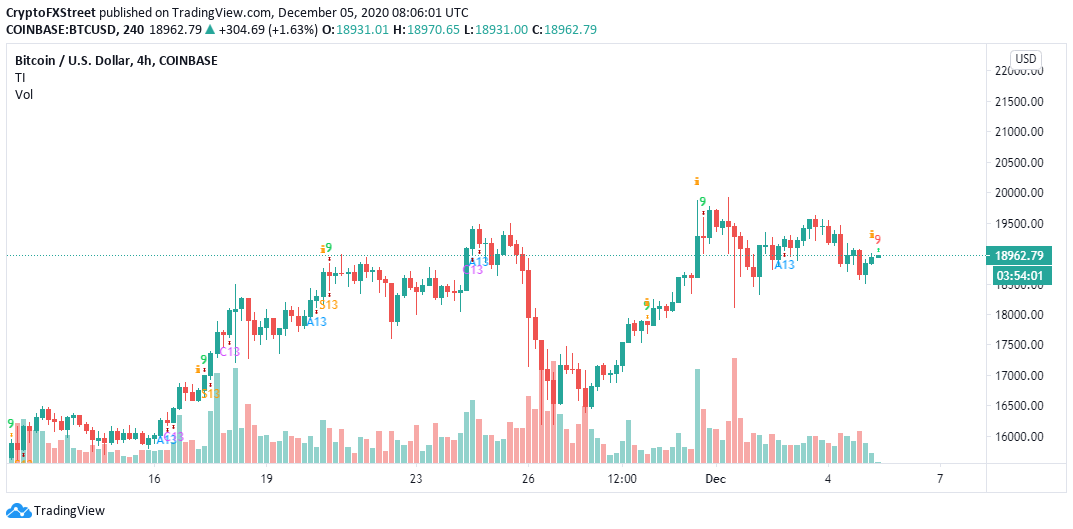
BTC/USD 4-hour chart
The TD Sequential indicator has also presented a buy signal on the 4-hour chart in the form of a green nine candlestick. Usually, when validated, the call to buy leads to a spike in one to four daily candlesticks. If the demand for Bitcoin increases, the bullish outlook might place the flagship cryptocurrency in a trajectory toward the coveted $20,000.
BTC/USD 4-hour chart
IntoTheBlock’s IOMAP model could invalidate the anticipated uptrend, mostly if the resistance between $19,021 and $19,079 is shattered. Here, nearly 761,000 addresses previously bought approximately 494,000 BTC. Note that trading above this zone will pave the way for gains to $19,300.
-637427535500886540.png)
Bitcoin IOMAP chart
On the flip side, the king of cryptocurrencies is accorded immense support, and therefore, it is doubtful that extended declines will come into the picture in the near term. For now, the most robust support lies at $17,824 and $18,384. Here, roughly 512,000 addresses previously bought nearly 381,000 BTC.
However, the 4-hour chart shows that a massive correction will occur if Bitcoin slumps below the confluence support created by the 50 SMA and the 100 SMA. The bearish leg is likely to extend to $17,000, support reinforced by the 200 SMA.
Author

John Isige
FXStreet
John Isige is a seasoned cryptocurrency journalist and markets analyst committed to delivering high-quality, actionable insights tailored to traders, investors, and crypto enthusiasts. He enjoys deep dives into emerging Web3 tren


