![]() Lorenzo Stroe
Lorenzo Stroe
Independent Analyst
- BTC is currently trading at $11,339 after a slight pullback from the peak of $11,736.
- Several on-chain metrics are showing Bitcoin is ready for a major price movement soon.
Bitcoin had a strong performance in the past week, climbing from a low of $10,575 to a high of $11,736, mostly impulsed by the positive news from several huge companies investing in Bitcoin. Stone Ridge, a multi-billion dollar company, recently announced the purchase of $115 million worth of BTC, around 10,000 coins.
Previously, Square, a company co-founded by Jack Dorsey, the CEO of Twitter, also announced they invested $50 million into Bitcoin, making the digital asset jump 2.5% within the next few hours, eventually breaking above $11,000 for the first time in a couple of weeks.
Numerous metrics are showing a significant price move is underway
Recent statistics released by Glassnode show that the interest in holding Bitcoin has been growing significantly over the past two years. The number of accumulation addresses, defined as ‘addresses that have at least two incoming transactions and have never spent BTC’, has increased significantly. This number was trending down since 2016.
BTC Accumulation Addresses Chart
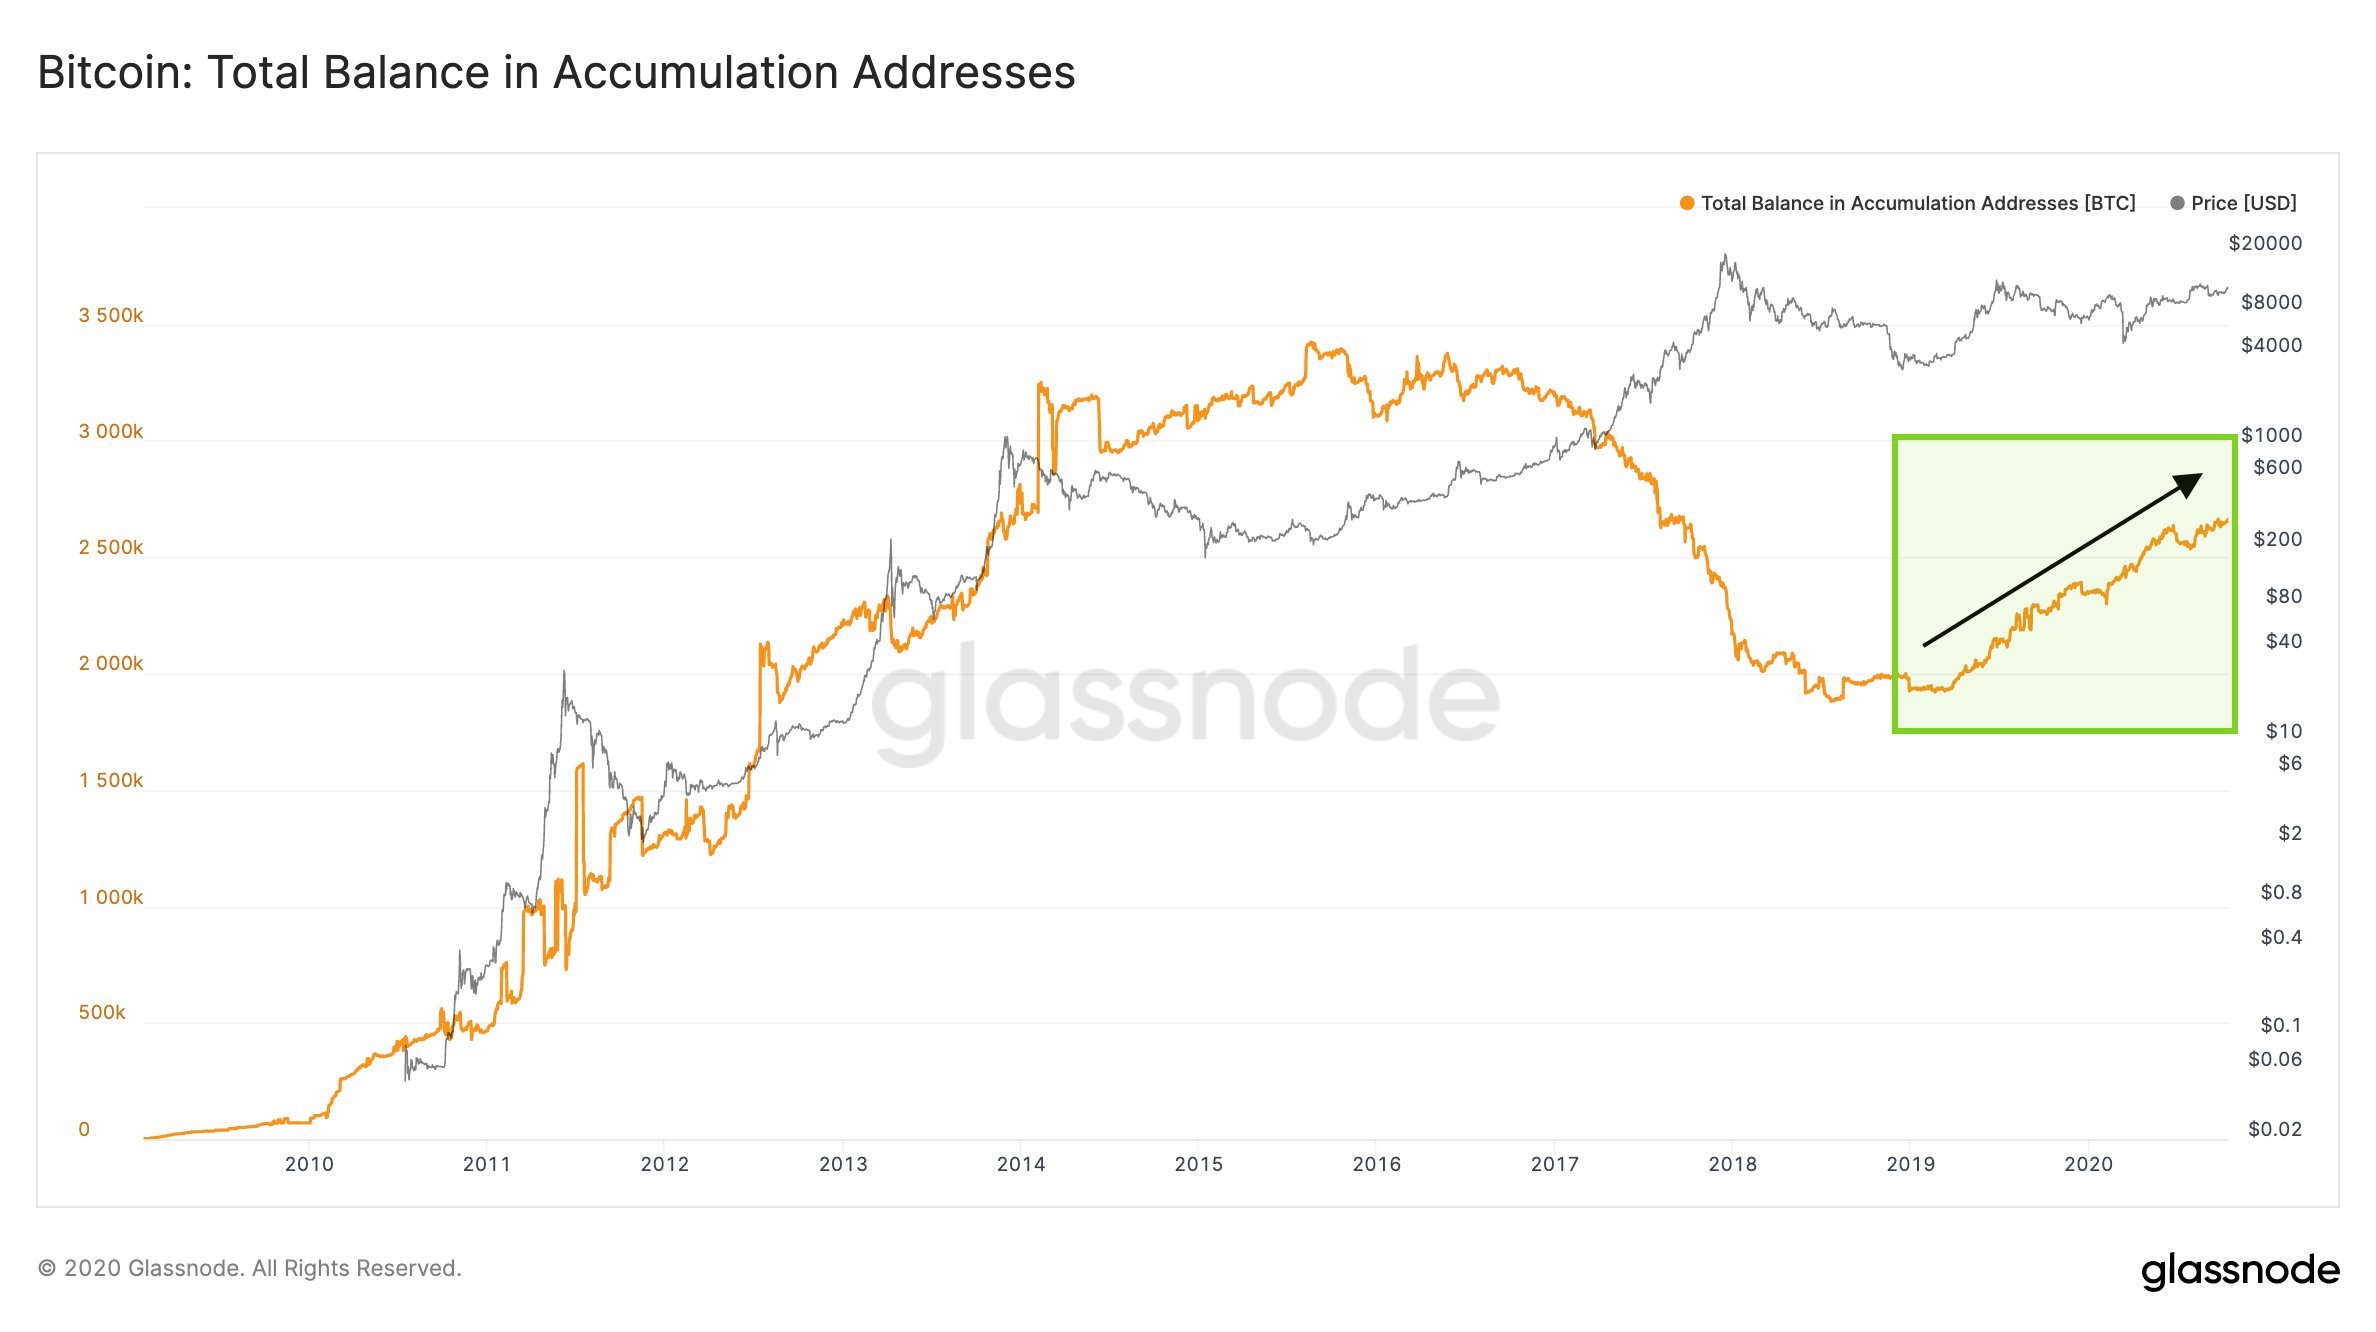
Looking at the daily chart, we can observe that Bitcoin is now trading inside an uptrend after establishing several higher lows and higher highs. The MACD has been bullish since September 15, and it’s still gaining positive momentum.
BTC/USD daily chart
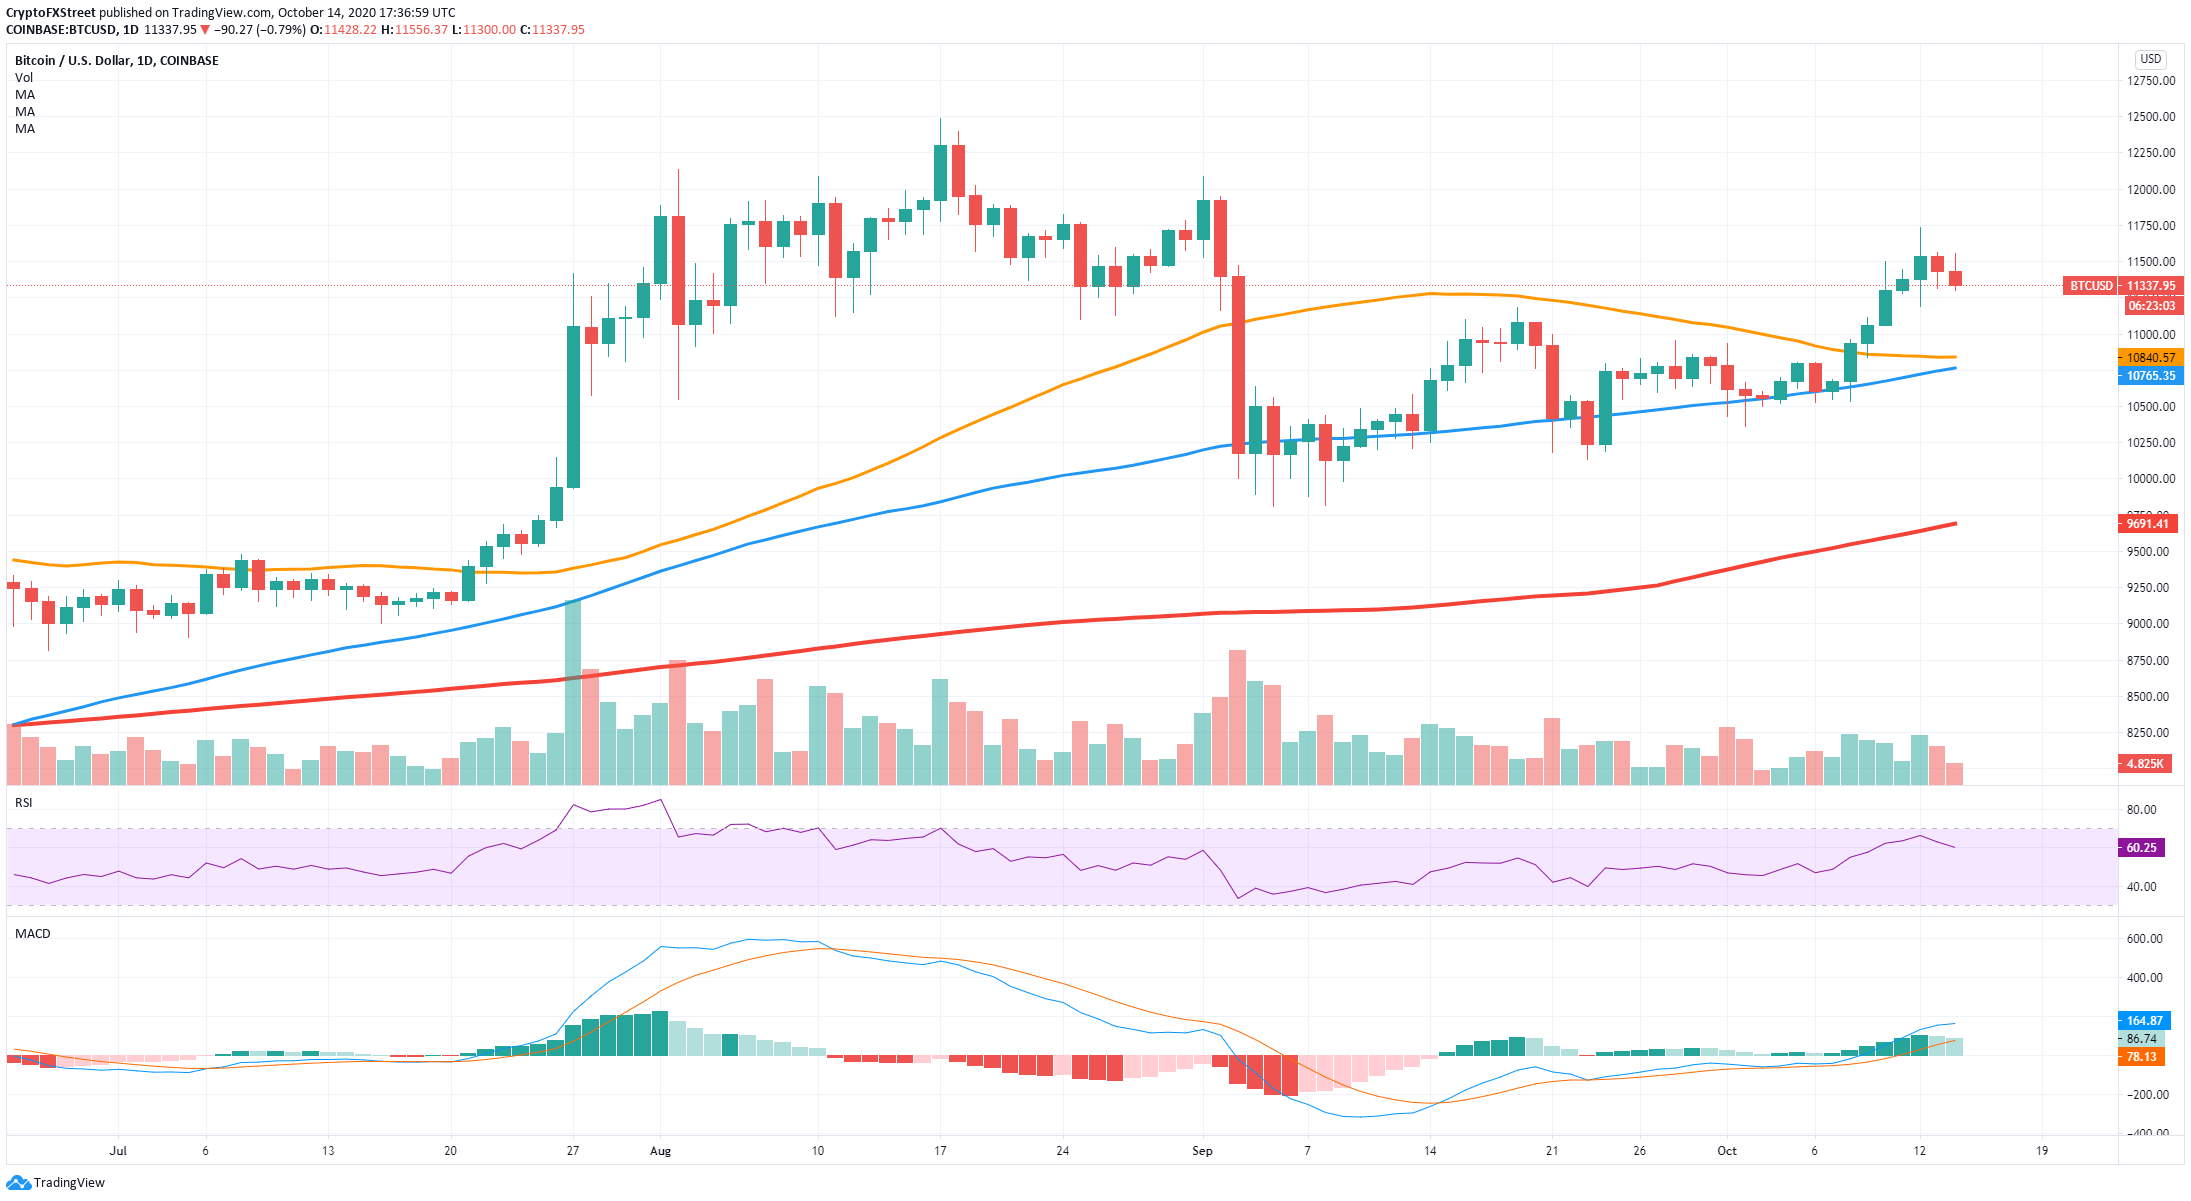
More importantly, the 100-SMA and the 50-SMA were both turned into support levels and defended several times on the way up. The RSI was close to being overbought but has cooled off quite a bit, thanks to the most recent 3% pullback.
BTC IOMAP Chart
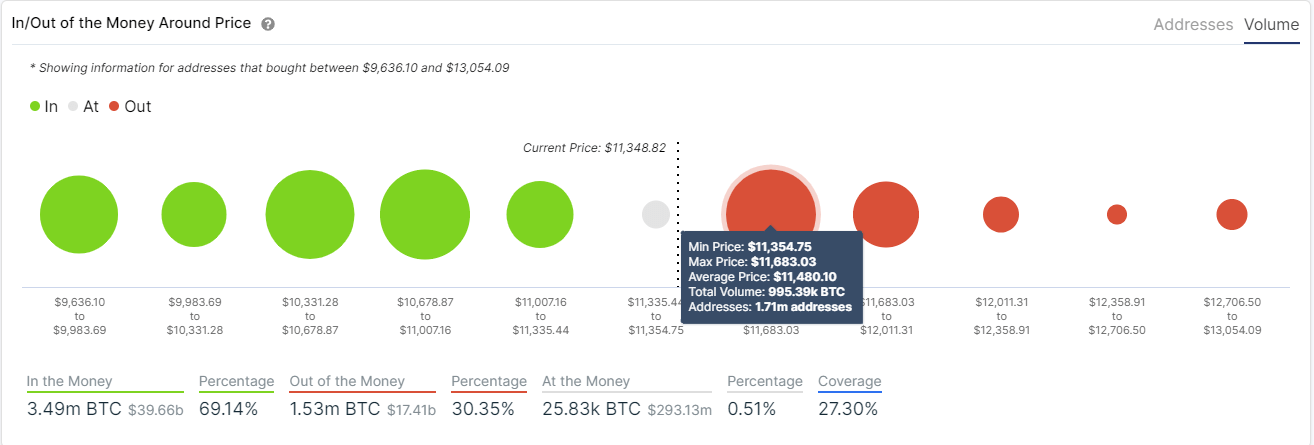
The In/Out of the Money Around Price chart shows a strong resistance area between $11,354 and $11,683 with almost 1 million in BTC volume; however, there are almost no hurdles above this point well into $13,000. A breakout above $11,683 could most certainly push Bitcoin at least towards $12,000 in the short-term.
BTC Volatility Chart
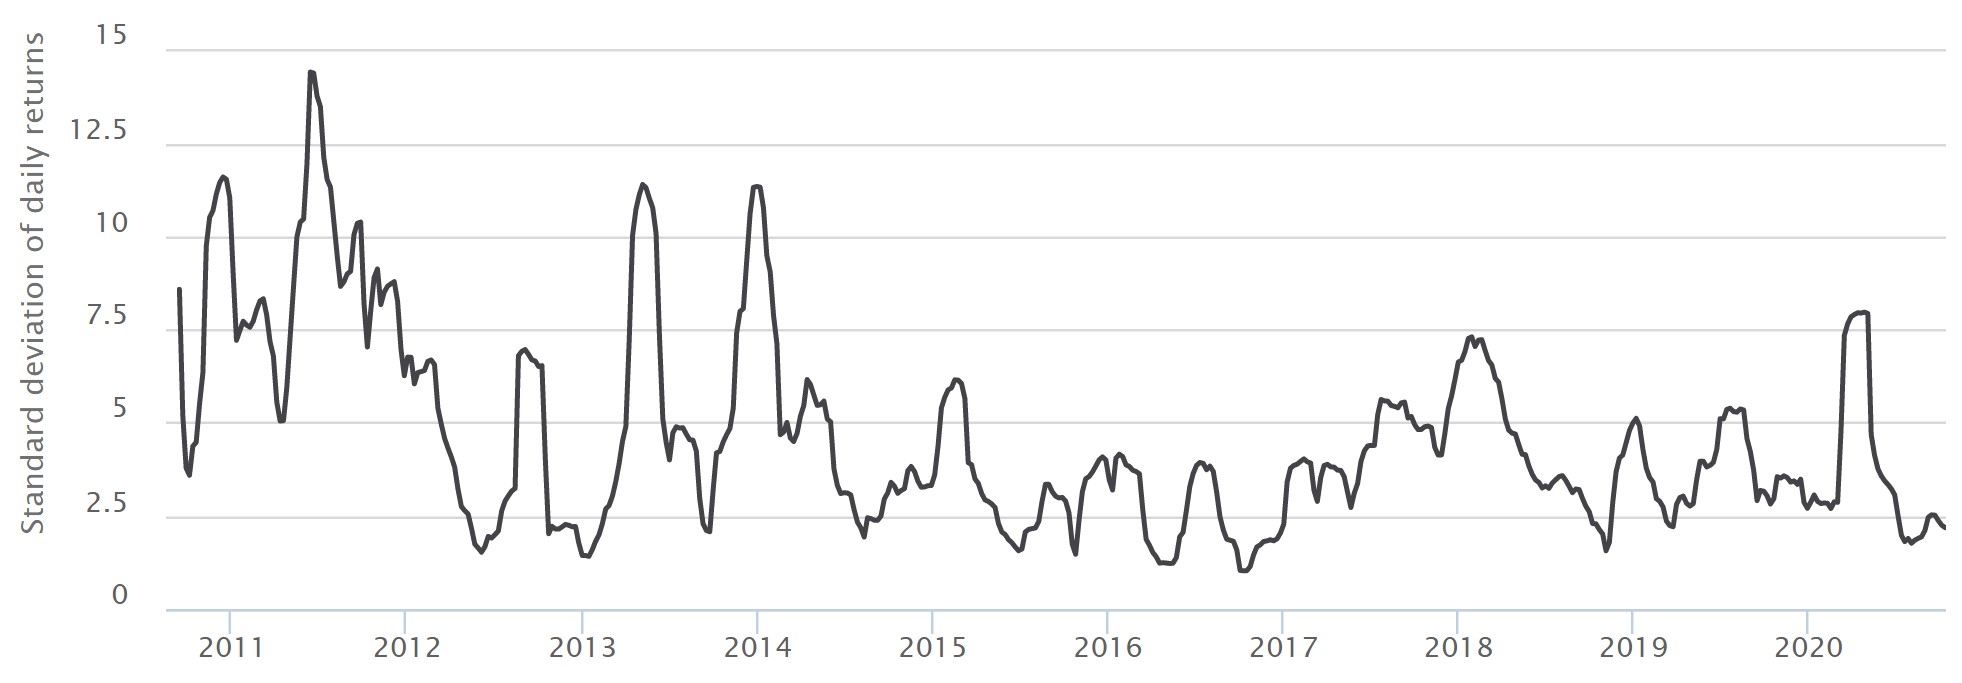
Another metric that supports the theory that Bitcoin is close to a major price move is the volatility. In the past few months, the volatility of the flagship cryptocurrency has declined significantly and is sitting near historic lows. When the number is so low, it’s usually an accurate indicator of major upcoming price moves.
Bearish signs for Bitcoin
Nonetheless, the bears are not out of the game just yet, especially after the last 3% pullback from the top at $11,736. Let’s explore several on-chain metrics in favor of the bears and any significant chart patterns and indicators on various time-frames.
BTC/USD daily chart
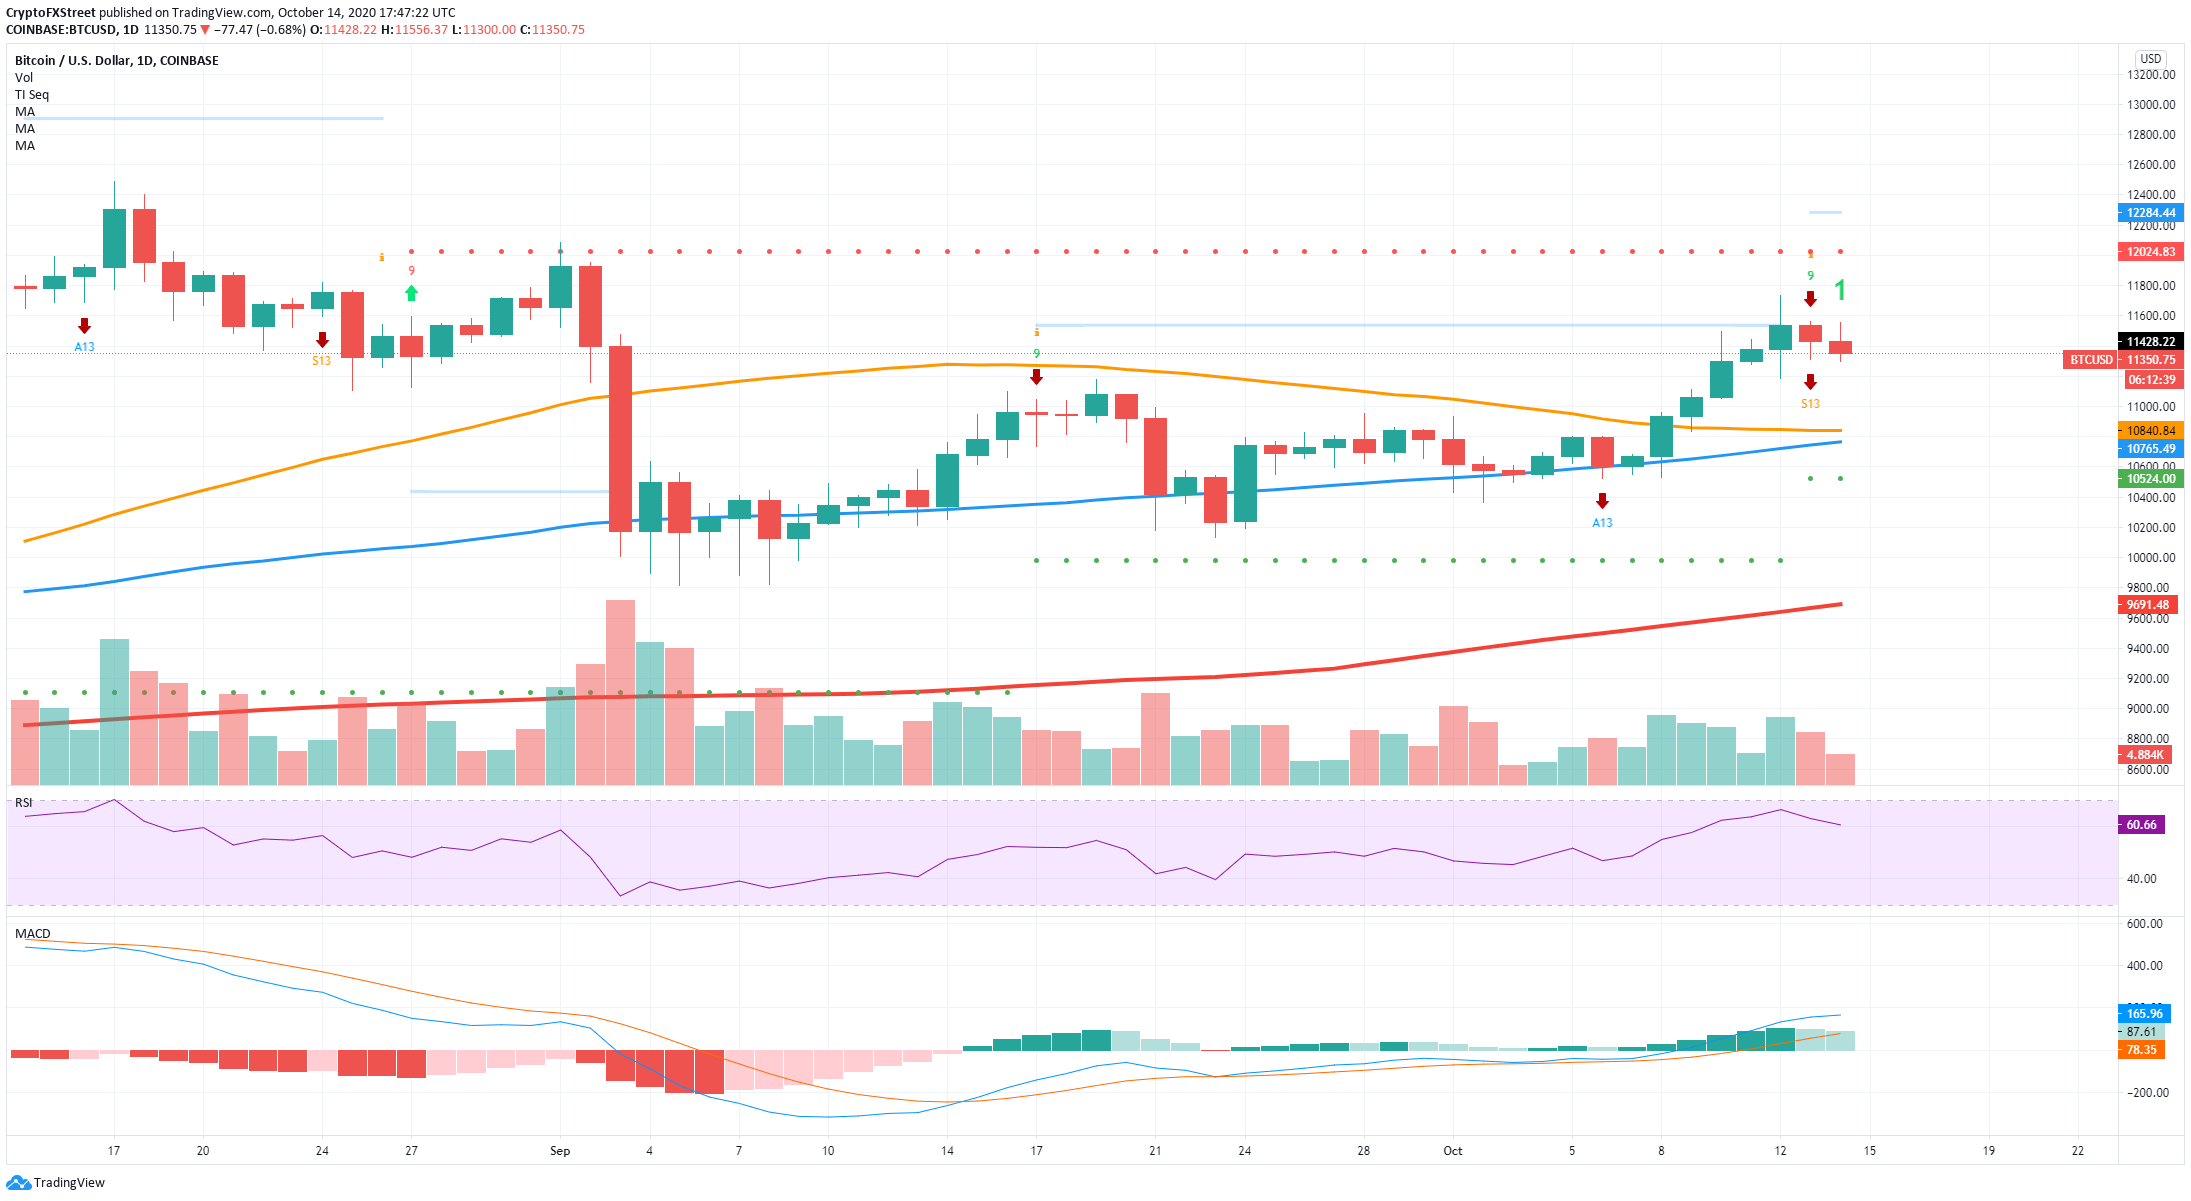
The most notable signal on the daily chart is the one presented by the TD sequential indicator. On October 13, the indicator posted a sell signal that seems to have been confirmed with the red candlestick we see today. Bitcoin could be eying up a re-test of the psychological support level at $11,000.
BTC Holders Distribution Chart
 [19.47.53, 14 Oct, 2020]-637382950149502511.png)
Another concerning trend for Bitcoin bulls is the number of whales exiting. Looking at the Holders Distribution chart provided by Santiment, we can notice the number of investors holding between 10,000 and 100,000 coins has been decreasing since October 6 from a high of 111 to only 107 currently.
BTC/USD 1-hour chart
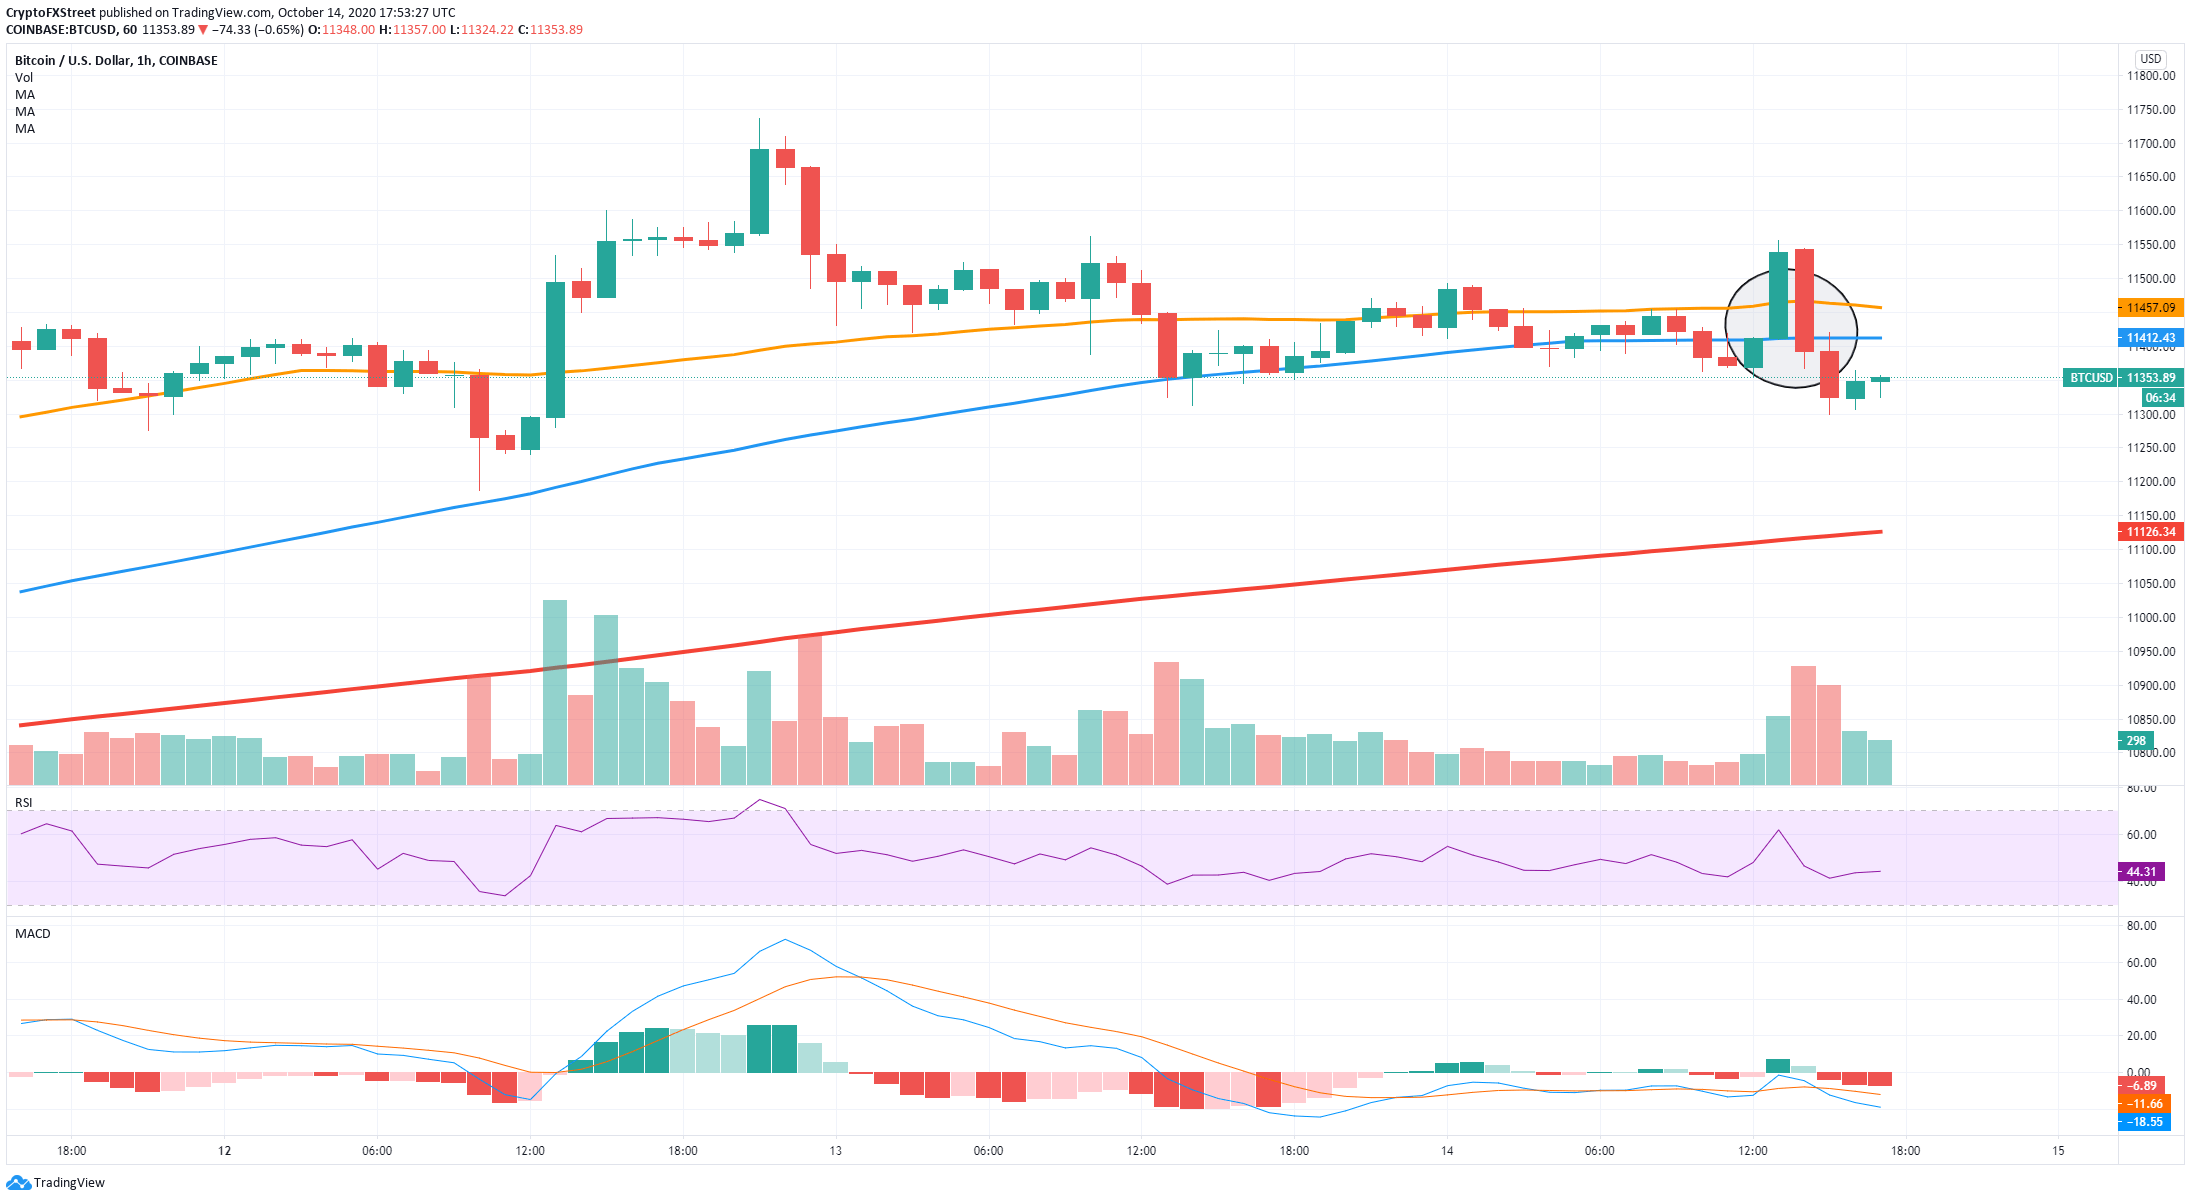
On the 1-hour chart, the bears took control already, pushing BTC's price below the 100-SMA and the 50-SMA, turning both into resistance levels. Additionally, they were able to establish lower lows and lower highs, confirming a downtrend.
Key price points to keep in mind
Investors looking for a bullish entry have to pay close attention to the only significant resistance area between $11,354 and $11,683. A breakout above this area can lead Bitcoin towards $12,000 and eventually even to $13,000 as there is very little resistance to the upside.
On the other hand, bears seem to have taken control in the short-term. The TD indicator presented a sell signal on the daily chart. Bearish continuation could push the flagship cryptocurrency towards the psychological level of $11,000.
Note: All information on this page is subject to change. The use of this website constitutes acceptance of our user agreement. Please read our privacy policy and legal disclaimer. Opinions expressed at FXstreet.com are those of the individual authors and do not necessarily represent the opinion of FXstreet.com or its management. Risk Disclosure: Trading foreign exchange on margin carries a high level of risk, and may not be suitable for all investors. The high degree of leverage can work against you as well as for you. Before deciding to invest in foreign exchange you should carefully consider your investment objectives, level of experience, and risk appetite. The possibility exists that you could sustain a loss of some or all of your initial investment and therefore you should not invest money that you cannot afford to lose. You should be aware of all the risks associated with foreign exchange trading, and seek advice from an independent financial advisor if you have any doubts.
Recommended Content
Editors’ Picks

Crypto trading volume declines further, signaling waning trader enthusiasm and market momentum
The total crypto market capitalization lost $1.01 trillion since January, while Santiment data shows that crypto-wide trading volume has dropped since February’s peak. For a healthier and more sustainable recovery, bulls look for rising prices accompanied by increasing volumes; until trading activity picks up, cautious market sentiment is likely to prevail.

BNB price tops $570 as Binance receives $2 billion investment from Dubai
BNB price rose as high as $574 on Thursday as markets reacted to news that Binance received major investments from an Abu Dhabi based firm. Derivative markets analysis shows how BNB traders are repositioning amid the latest swings in market sentiment.

PEPE price outperforming DOGE and SHIB as US CPI boosts Crypto markets
PEPE price crossed the $0.00007 for the first time this week as markets reacted to positive macro market signals. Early insights show crypto traders are displaying high risk appetite at the onset of the current market rally. Could this sustain PEPE price uptrend along with the rest of the memecoin market.

XRP records slight gains as Ripple's battle with SEC nears end
Ripple's XRP recorded a 2% gain on Wednesday following rumors of the company nearing an agreement with the Securities & Exchange Commission (SEC) to end their four-year legal battle.

Bitcoin: Will Trump's Strategic Bitcoin Reserve and White House Crypto Summit support BTC recovery?
Bitcoin price extends its decline on Friday, falling over 5% so far this week. BTC uncertainty and volatility spikes liquidated $1.67 billion as the first-ever White House Crypto Summit takes place on Friday.

The Best brokers to trade EUR/USD
SPONSORED Discover the top brokers for trading EUR/USD in 2025. Our list features brokers with competitive spreads, fast execution, and powerful platforms. Whether you're a beginner or an expert, find the right partner to navigate the dynamic Forex market.