Bitcoin price prediction: BTC may have a date with $40,000 next week
- Bitcoin price uptrend has faced opposition around the $35,280 range high on the daily timeframe.
- The pullback has seen BTC price action form a pennant with a forecasted $40,153 target.
- The bullish outlook will be invalidated if the king of crypto breaks and closes below the $38,000 psychological level.
- Meanwhile, hope for a spot BTC ETF remains alive, with the halving narrative still a constant for Bitcoin bull run.

Bitcoin (BTC) price could hit $40,000 next week after a significant move north this week. The bullishness was not driven by anything in particular, although three narratives came to mind during the run. These were:
- Federal Reserve Chair Jerome Powell’s speech at the Economic Club of New York.
- Bitcoin halving, slated for April 2024, is now around six months away.
- Speculation on a spot BTC exchange-traded fund (ETF) launching soon.
Also Read: Crypto asset manager Hashdex submits an “undeniable” spot Bitcoin ETF application to the SEC
Bitcoin, altcoins, stablecoins FAQs
What is Bitcoin?
Bitcoin is the largest cryptocurrency by market capitalization, a virtual currency designed to serve as money. This form of payment cannot be controlled by any one person, group, or entity, which eliminates the need for third-party participation during financial transactions.
What are altcoins?
Altcoins are any cryptocurrency apart from Bitcoin, but some also regard Ethereum as a non-altcoin because it is from these two cryptocurrencies that forking happens. If this is true, then Litecoin is the first altcoin, forked from the Bitcoin protocol and, therefore, an “improved” version of it.
What are stablecoins?
Stablecoins are cryptocurrencies designed to have a stable price, with their value backed by a reserve of the asset it represents. To achieve this, the value of any one stablecoin is pegged to a commodity or financial instrument, such as the US Dollar (USD), with its supply regulated by an algorithm or demand. The main goal of stablecoins is to provide an on/off-ramp for investors willing to trade and invest in cryptocurrencies. Stablecoins also allow investors to store value since cryptocurrencies, in general, are subject to volatility.
What is Bitcoin Dominance?
Bitcoin dominance is the ratio of Bitcoin's market capitalization to the total market capitalization of all cryptocurrencies combined. It provides a clear picture of Bitcoin’s interest among investors. A high BTC dominance typically happens before and during a bull run, in which investors resort to investing in relatively stable and high market capitalization cryptocurrency like Bitcoin. A drop in BTC dominance usually means that investors are moving their capital and/or profits to altcoins in a quest for higher returns, which usually triggers an explosion of altcoin rallies.
A pennant could send Bitcoin to $40,000 next week
Bitcoin (BTC) price has formed a pennant on the daily timeframe, with the technical formation interpreted as a continuation chart pattern to predict the longevity of the primary trend. This chart pattern appears whenever an asset displays a large upward or downward movement, followed by a brief consolidation, before continuing to move in the same direction it was moving before interruption.
The pennant for Bitcoin price has formed a symmetrical triangle and a flagpole, marked by the initial strong move that came before the triangle formation. In the daily chart below, it is marked by the purple line trailing BTC from the October 19 candlestick to the intra-day high of $35,280 recorded on October 24. Other important parts of the pennant are the breakout levels (either bullish or bearish) and the pennant itself.
Bitcoin price prediction with a Pennant pattern in play
Bitcoin price remains bullish after a 30% run north beginning around mid-October. However, the king of crypto was rejected at the $35,280 level as profit-booking commenced.
The Relative Strength Index (RSI) is dropping, pointing to falling momentum. The Tenkan and Kijun indicators, known for enhancing the visual perception of price action, corroborate this outlook. They are flattening at $31,690 and $30,909 to show a weakness in Bitcoin price.
As such, it is plausible that Bitcoin price could record a pullback before the BTC race north resumes. In such a case, the downside target could be the $33,000, $32,000, or the critical $31,777 level.
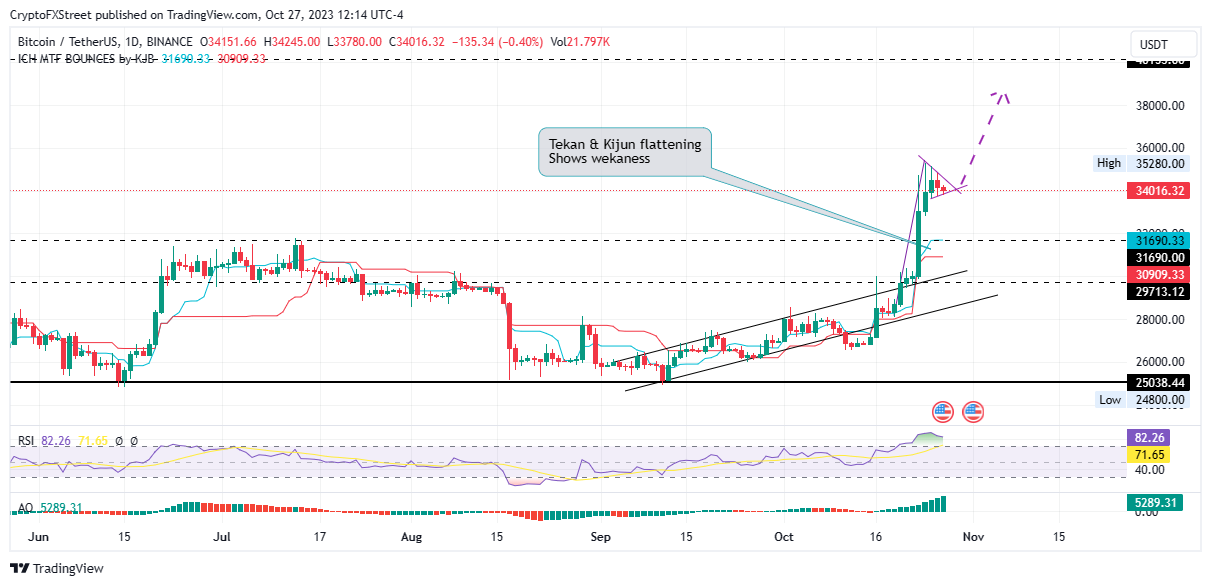
BTC/USDT 1-day chart
On the other hand, if the pennant chart pattern continues, Bitcoin price could move north, breaching the $35,000 psychological level and clearing the $35,280 range high. In a highly bullish case, the flagship crypto could teleport to the $40,000 psychological level, possibly tagging the $40,153 resistance level. Such a move would constitute a 20% climb above current levels.
Only time will, even as the market heads into the weekend. Nevertheless, with Bitcoin price showing mixed signals in the immediate short term, investors continue to find hope in the possibility of the US Securities & Exchange Commission (SEC) approving a spot BTC ETF soon. They also continue watching the calendar for the Bitcoin halving, 187 days out. Hope also comes from the Fed Chair Powell, whose recent speech was interpreted as mildly dovish, causing the US Dollar (USD) to sell off as a result. Bitcoin, which is negatively correlated to the USD, saw marginal gains in the aftermath.
Author

Lockridge Okoth
FXStreet
Lockridge is a believer in the transformative power of crypto and the blockchain industry.


