• BTC is trading at $12,947 after a colossal rally towards $13,250.
  • It seems that nothing is stopping Bitcoin; however, some indicators have flipped bearish.

Bitcoin is back above 60% market dominance and climbed above $13,000 for the first time since June 2019. In the past week alone, BTC's total market capitalization has increased by over $31 billion.

Bitcoin could be facing a retrace in the short-term

The flagship cryptocurrency is up 13% in the past 48 hours after a massive announcement from PayPal to support digital assets like BTC, ETH, BCH, and LTC. Bulls are eying up $20,000; however, there is a chance that Bitcoin will face a pullback first. 

BTC/USD 12-hour chart

btc price

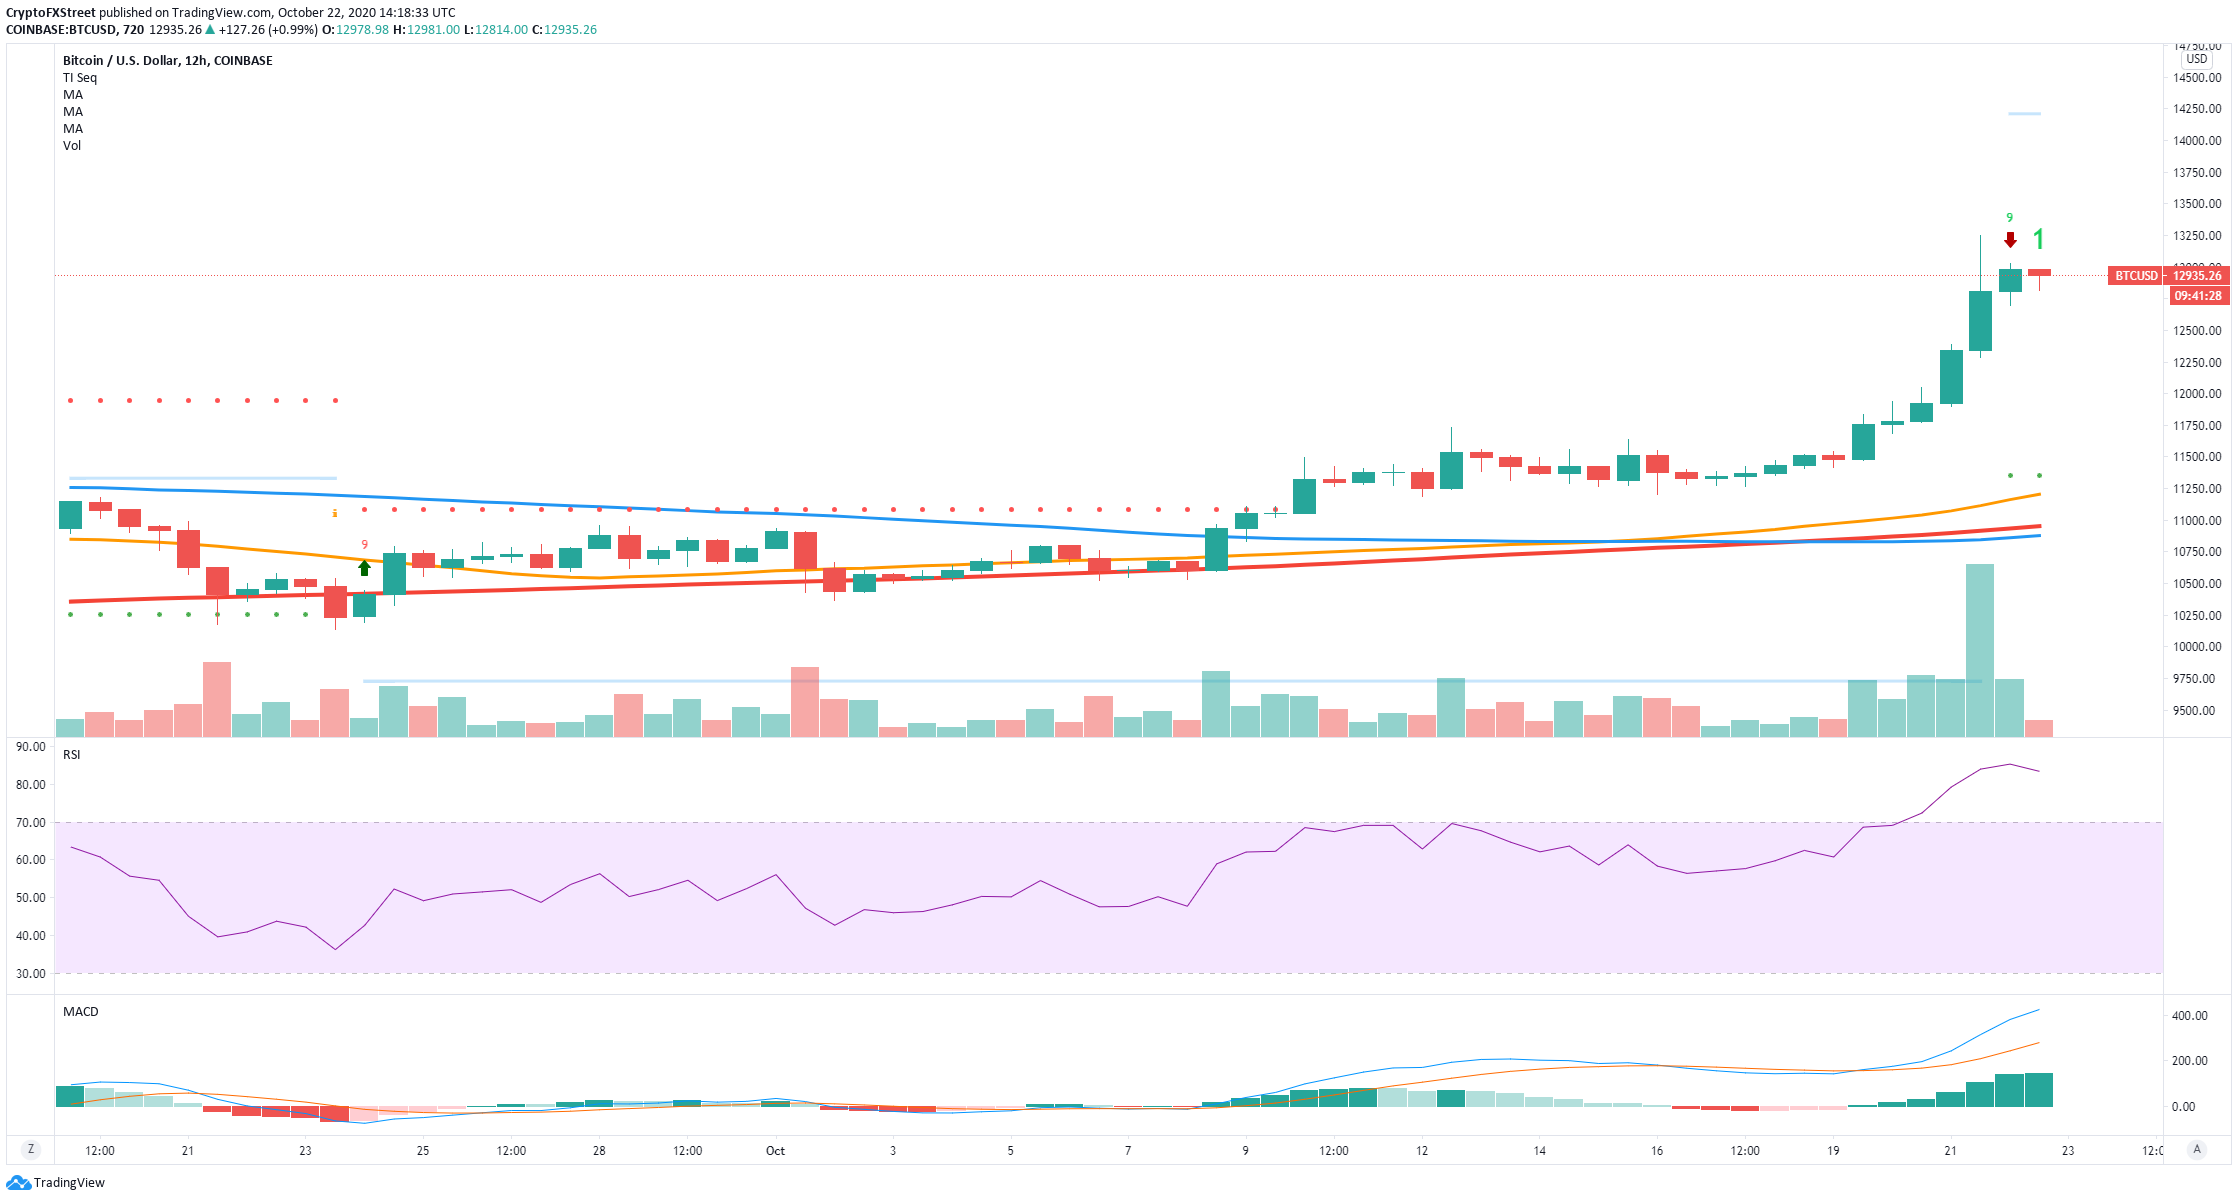
The TD sequential indicator has presented a sell signal on the 12-hour chart, the first since September 18. Additionally, the RSI is heavily overextended, which also adds further selling pressure to Bitcoin. 

BTC IOMAP Chart

btc price

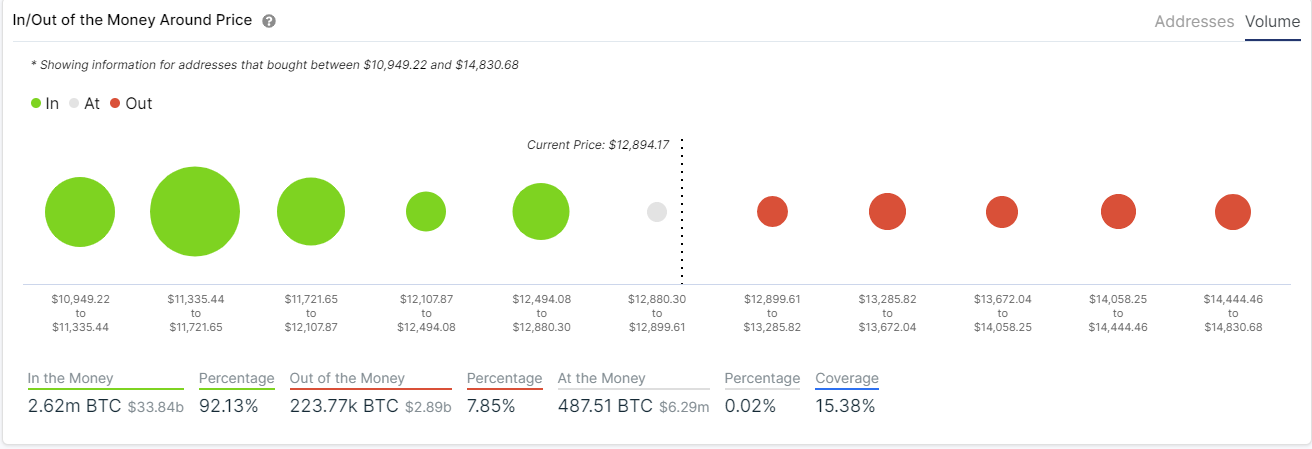
The In/Out of the Money Around Price chart shows the next substantial support area to be between $11,721 and $12,107, which means that Bitcoin could see a pullback down to $12,107 and possibly the psychological support level at $12,000 to re-test it. 

BTC Holders Distribution Chart

btc price

Another concerning trend can be seen using the BTC Holders Distribution chart. It seems that the number of whales holding between 10,000 and 100,000 coins has decreased by seven in the past week, indicating that they are taking profits. 

BTC/USD 4-hour chart

btc price

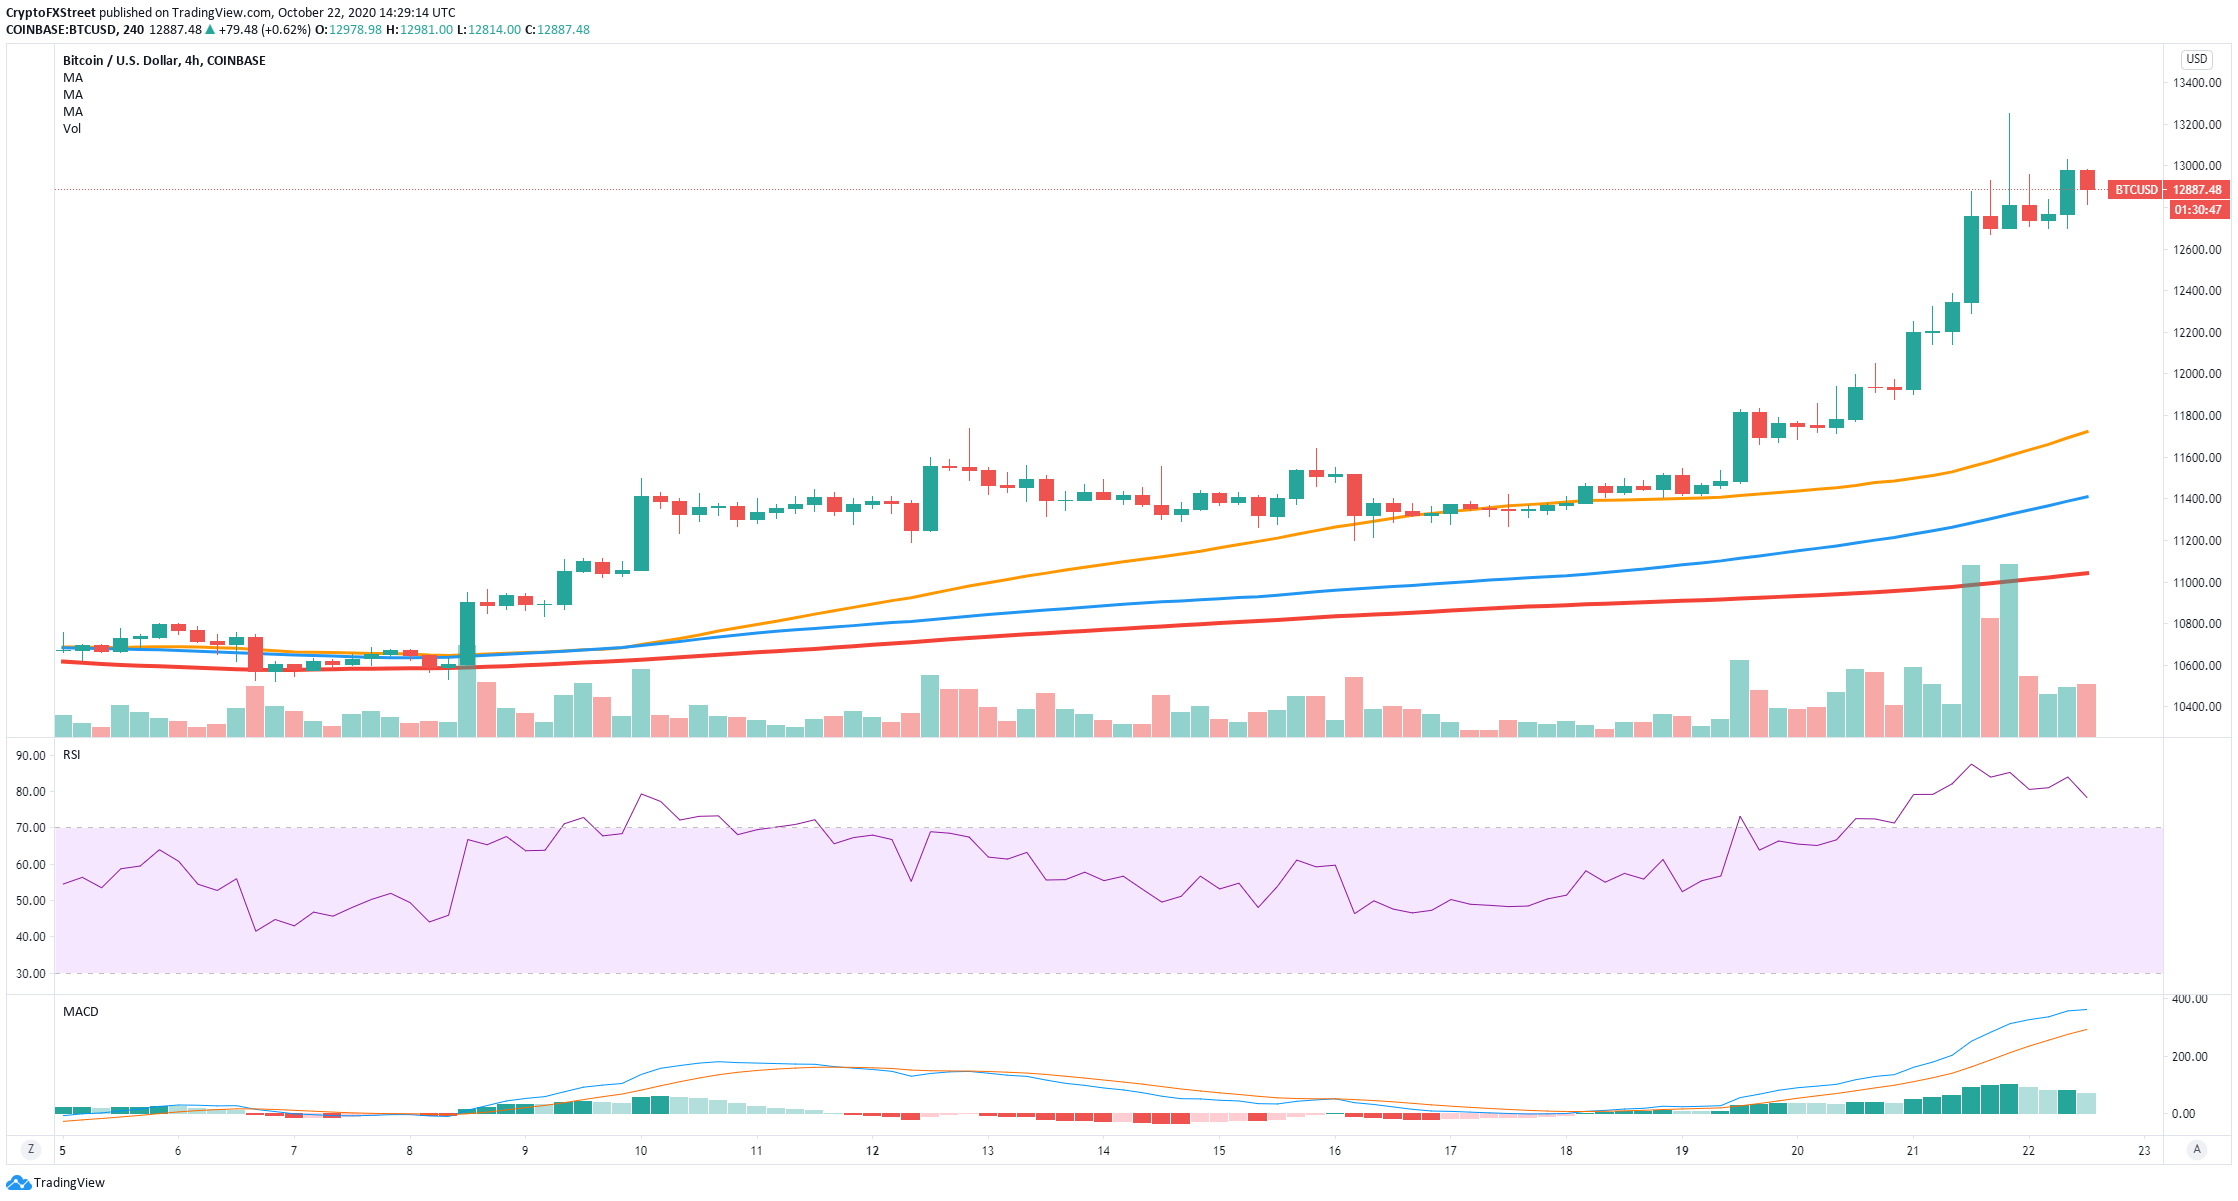
Nonetheless, most time frames are still in favor of the bulls, which are holding the uptrends. The 4-hour chart is presenting a possible bull flag with a MACD gaining a lot of strength. The price is way above the SMAs and EMAs.

Observing the same IOMAP chart above, we can also notice that resistance above the $12,899 level is feeble compared to support. Another breakout above the $13,000 point can drive BTC up to $14,000.

Crucial price levels for Bitcoin investors

Despite Bitcoin's bullish sentiment and the entire cryptocurrency market, the flagship cryptocurrency could be facing a short-term pullback before climbing to its all-time high of $20,000. Validation of the sell signal on the 12-hour chart can push BTC down to $12.000.

On the other hand, bulls are still in control over most time frames and are eying up $14,000 as the next price target. A breakout above the new psychological resistance level at $13,000 can achieve this goal as the IOMAP chart shows very little opposition to the upside.


Note: All information on this page is subject to change. The use of this website constitutes acceptance of our user agreement. Please read our privacy policy and legal disclaimer. Opinions expressed at FXstreet.com are those of the individual authors and do not necessarily represent the opinion of FXstreet.com or its management. Risk Disclosure: Trading foreign exchange on margin carries a high level of risk, and may not be suitable for all investors. The high degree of leverage can work against you as well as for you. Before deciding to invest in foreign exchange you should carefully consider your investment objectives, level of experience, and risk appetite. The possibility exists that you could sustain a loss of some or all of your initial investment and therefore you should not invest money that you cannot afford to lose. You should be aware of all the risks associated with foreign exchange trading, and seek advice from an independent financial advisor if you have any doubts.

Join Telegram

Recommended content


Recommended Content

Editors’ Picks

Ripple on-chain metrics show bullish signs amidst legal struggle with SEC, XRP eyes recovery

Ripple on-chain metrics show bullish signs amidst legal struggle with SEC, XRP eyes recovery

Ripple made a comeback above $0.48 on Tuesday and hovers above that level in Wednesday’s European session. Ripple on-chain metrics such as transaction volume and Network Realized Profit/Loss have turned bullish, supporting a recovery in the altcoin. 

More Ripple News

Bitcoin price falls amidst German government transfers, miners activity

Bitcoin price falls amidst German government transfers, miners activity

Bitcoin (BTC) extends correction on Wednesday and hovers around $61,000 after finding resistance near the $64,000 level on Monday. Recent on-chain data indicates heightened selling activity from Bitcoin miners early in the week. 

More Bitcoin News

Crypto Today: Bitcoin erases gains from end of June, Ethereum declines while Ripple holds

Crypto Today: Bitcoin erases gains from end of June, Ethereum declines while Ripple holds

Bitcoin wipes out gains from the last week of June and falls below $60,000 on Wednesday. Ethereum and top altcoins ranked by market capitalization erased gains as the inflation outlook worsened. Ripple holds on to recent gains and hovers above $0.48 on Wednesday. 

More Cryptocurrencies News

Three reasons why altcoins could shake off losses this week

Three reasons why altcoins could shake off losses this week

On-chain data from Santiment shows that altcoins are currently in the opportunity zone, or generating buy signals. The top three altcoins in the buy zone are Basic Attention Token (BAT), Chromia (CHR), and Highstreet (HIGH), per Santiment. 

More Altcoins News

Bitcoin: BTC price correction could end in July, according to seasonal data

Bitcoin: BTC price correction could end in July, according to seasonal data

Bitcoin (BTC) price appears poised for a decline this week, influenced by slight outflows in US spot ETFs, selling activity among BTC miners, and a combined transfer of 4,690.28 BTC to centralized exchanges by the US and German governments.

Read full analysis

BTC

ETH

XRP