Bitcoin price nears ‘golden cross’ but will BTC finally conquer $10k?

The price of Bitcoin (BTC), the top cryptocurrency by market capitalization, is trading down 2.59% for today’s session at $9,540, erasing the push towards $10,000 late on Thursday.
Ether (ETH), the second biggest crypto by market cap, is down a little less by 1.72% and retesting the critical $200 level, while XRP also attempts to maintain a key level of $0.20.
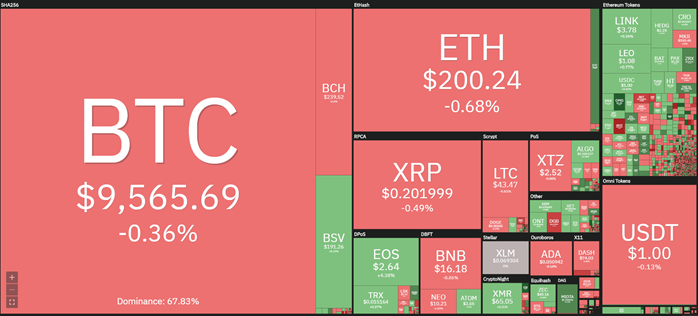
Cryptocurrency market 24-hour view. Source: Coin360
1-week chart
The weekly candle chart for the Bitcoin shows it’s currently trading above high time frame resistance of $9,300, having recovered the majority of the 20% flash sell-off last weekend, where support was found close to the 20-week moving average.
The Moving Average Convergence Divergence (MACD) indicator illustrates the upward momentum and general trend reversal since the selloff in early March.
Volumes have remained above average for the week, with two and a half days of trading remaining, highlighting the bullish response to take the price of Bitcoin back across the $9,000 following last week’s pre-halving drop
Should the bulls break resistance around $10,000, a relatively fast move to test $11,500 and the middle of the range above would be the target although Bitcoin has not traded at these prices since August 2019.
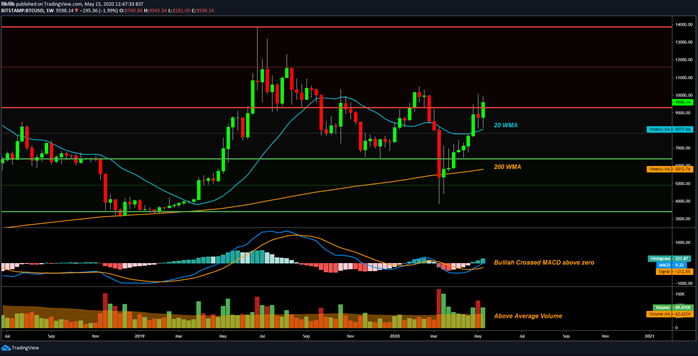
BTCUSD 1 Week chart. Source: Tradingview
1-day chart
The one-day chart shows that BTC/USD is currently finding some support today at the $9,300 level after a sudden drop as price approached $10,000. In other words, Bitcoin has formed a lower high on the daily timeframe.
Last week, both the 100 and 200-day moving averages (MA) also acted as the first line of defense alongside the 20-week MA. The 50-day MA is on course to cross above both the 100 and 200-day moving averages before the end of the month.
The so-called “golden cross” typically signals to the market to expect higher prices and will be positive for the Bitcoin bulls. However, Bitcoin has a tendency to initially react adversely to such a bullish sign.
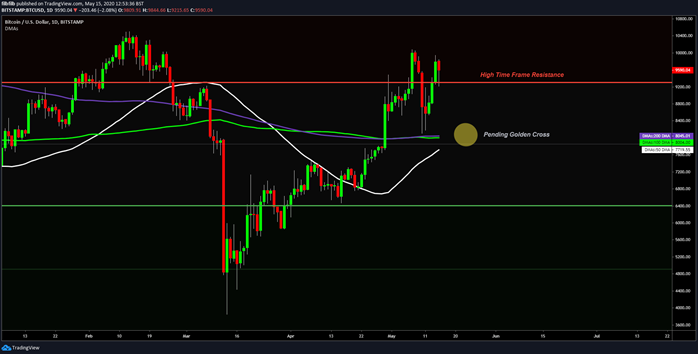
BTCUSD 1-week chart. Source: Tradingview
The MACD on the one-day chart shows that it is threatening to cross bullish above zero, meaning that Bitcoin is generally maintaining its bullish trend. However, like the RSI, there is evidence of weakness within the uptrend now as resistance has been confirmed at $10,000.
The On Balance Volume (OBV) indicator also highlights a loss in the cumulative volume trend to the upside. The indicator bears the scars of the high volume breakdown last week and has not yet quite found the bullish volume to recover the upward trend.
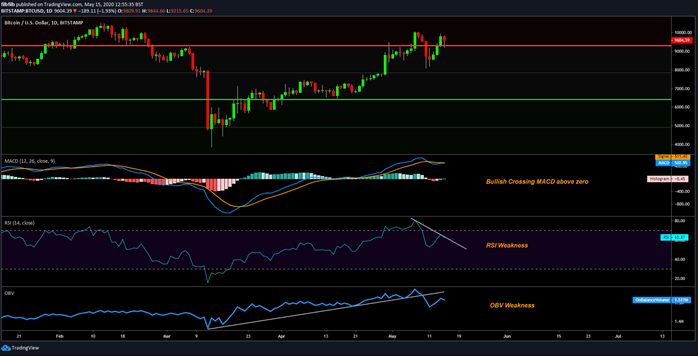
BTCUSD 1-day chart. Source: Tradingview
4-hour chart
The four-hour chart highlights in more detail the potential weakness described on the one-day chart. Volume over the last day topped out at a failed retest of $10,000, but price remains supported above key resistance, which is very positive.
The four-hour MACD, however, clearly demonstrates the downturn in momentum, which is also supported by the Stoch-RSI that’s also trending to the downside. Both hint that there may need to be a consolidation to allow the indicators to reset.
As we move into the CME close on Friday, traders may be looking to offload risk, particularly given the sell-off on spot exchanges over last weekend. Therefore, price action on Friday may be representative of such.
Should there be a selloff over the weekend once more, the point of control around the $8,900 level would be the first to show real buying interest as the bulls battled to break the level all week.
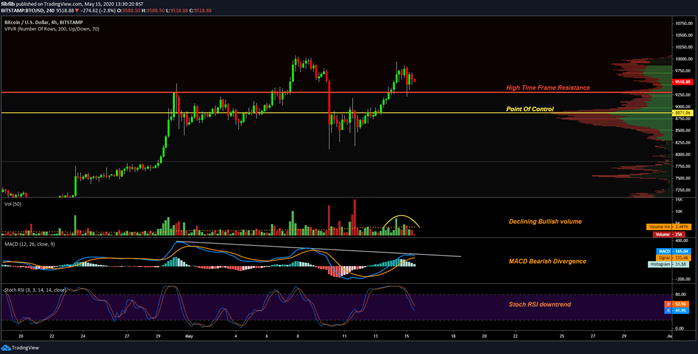
BTCUSD 4-hour chart. Source: Tradingview
A brief look at a combined order book representing large buy and sell orders as a heat map on the below chart shows that there is a large amount of selling interest around the $10,000 level, which is effectively capping price for now.
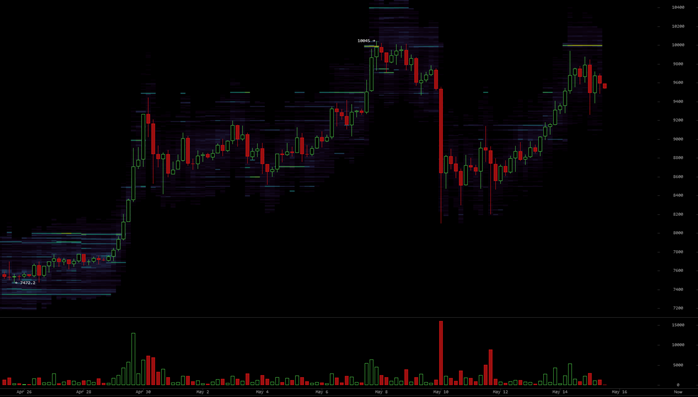
BTCUSD 4-hour chart. Source: Bitcoinwisdom
Market sentiment
The forward curve for the futures price of Bitcoin remains in contango with the futures price being around 1% higher than the present spot price for contracts ending in July.
This has steadily increased over the recent weeks demonstrating a more positive outlook for the price of Bitcoin in months to come. However, the premium on the future price at 1% is very low in comparison to previous bull runs and indicates that the bulls are not in a state of euphoria suggesting traders are more cautious this time around.
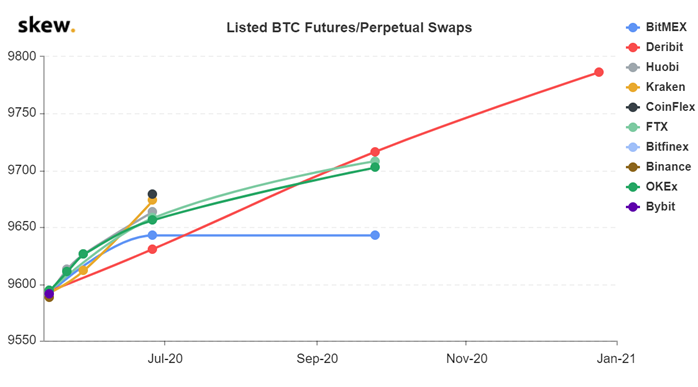
Listed BTC futures/perpetual swaps. Source: Skew
The CME futures chart shows that Open Interest (unsettled derivative contracts) is at all-time highs, crossing the $500m level, with interest really ramping up since the selloff in March and being significantly higher than other notable highs at $10,000 and $14,000 back in 2019.
Generally speaking, open interest rising as price increases is a positive sign as more money and attention are entering the market.
As we have seen previously, however, particularly high open interest on the CME and other derivative exchanges for Bitcoin has had an inverse relationship with the price shortly thereafter.
Therefore, this increase at the CME is of particular interest as it has made highs at a critical point of resistance and indicates there may be an explosive outcome once the market has determined in which direction it intends to move.
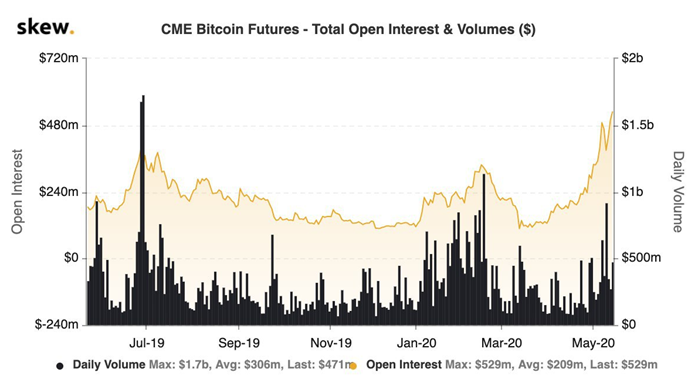
CME Bitcoin futures open interest. Source: Skew
A review of the Crypto Fear and Greed index shows that the market remains in a state of fear having recovered from somewhat understandable extreme fear seen with the $4K bottom in March.
Despite having recovered significantly, the market sentiment clearly mirrors that of the futures market in demonstrating a conservative outlook on the price by the public.
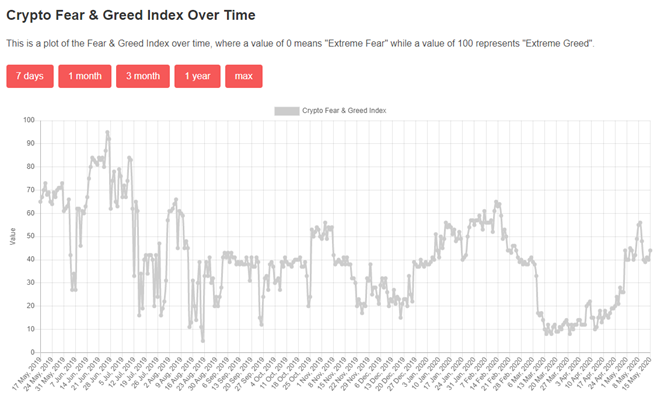
Crypto Feat & Greed index. Source: Alternative.me
Looking forward
It is clear that interest in the Bitcoin market has continued to gather pace and has overwhelmingly helped the price of Bitcoin recover rapidly in recent months. This is encouraging for the market, demonstrating that there are plentiful mechanisms for the market to enable the inflow of liquidity.
Many new entrants to the market are betting on Bitcoin being a safe haven asset, over which remains some debate. Hence this being borne out in the open interest levels. The next two weeks and the close of May will prove pivotal for the market, which will see the bulls and bears continue to battle over the $10K level with $9,300 being a critical level for the bulls to break.
Bears having previously enjoyed short positions on Bitcoin from around $10,000 in the past will most likely be looking to push prices back down to the $6,500 level, which would be expected to be met with resilience from the bulls at $8,000. Whereas a capitulation on the bearish side would most likely see Bitcoin press towards $11,500 very quickly.
Author

Cointelegraph Team
Cointelegraph
We are privileged enough to work with the best and brightest in Bitcoin.


