Bitcoin price is ‘likely starting the next push up’ if $42K holds as support

Multiple technical indicators suggest that BTC is preparing for a breakout, despite concerns about rising inflation and conflict in Ukraine.
The cryptocurrency market remains in a state of flux as investors are once again focused on what steps the U.S. Federal Reserve might take to combat rising inflation and markets wobble as the situation in Ukraine remains tense.
Data from Cointelegraph Markets Pro and TradingView shows that the price of Bitcoin (BTC) has hovered around the $44,000 support level and traders are hopeful that an inverse head and shoulders chart pattern will lead to a sustained bullish breakout.
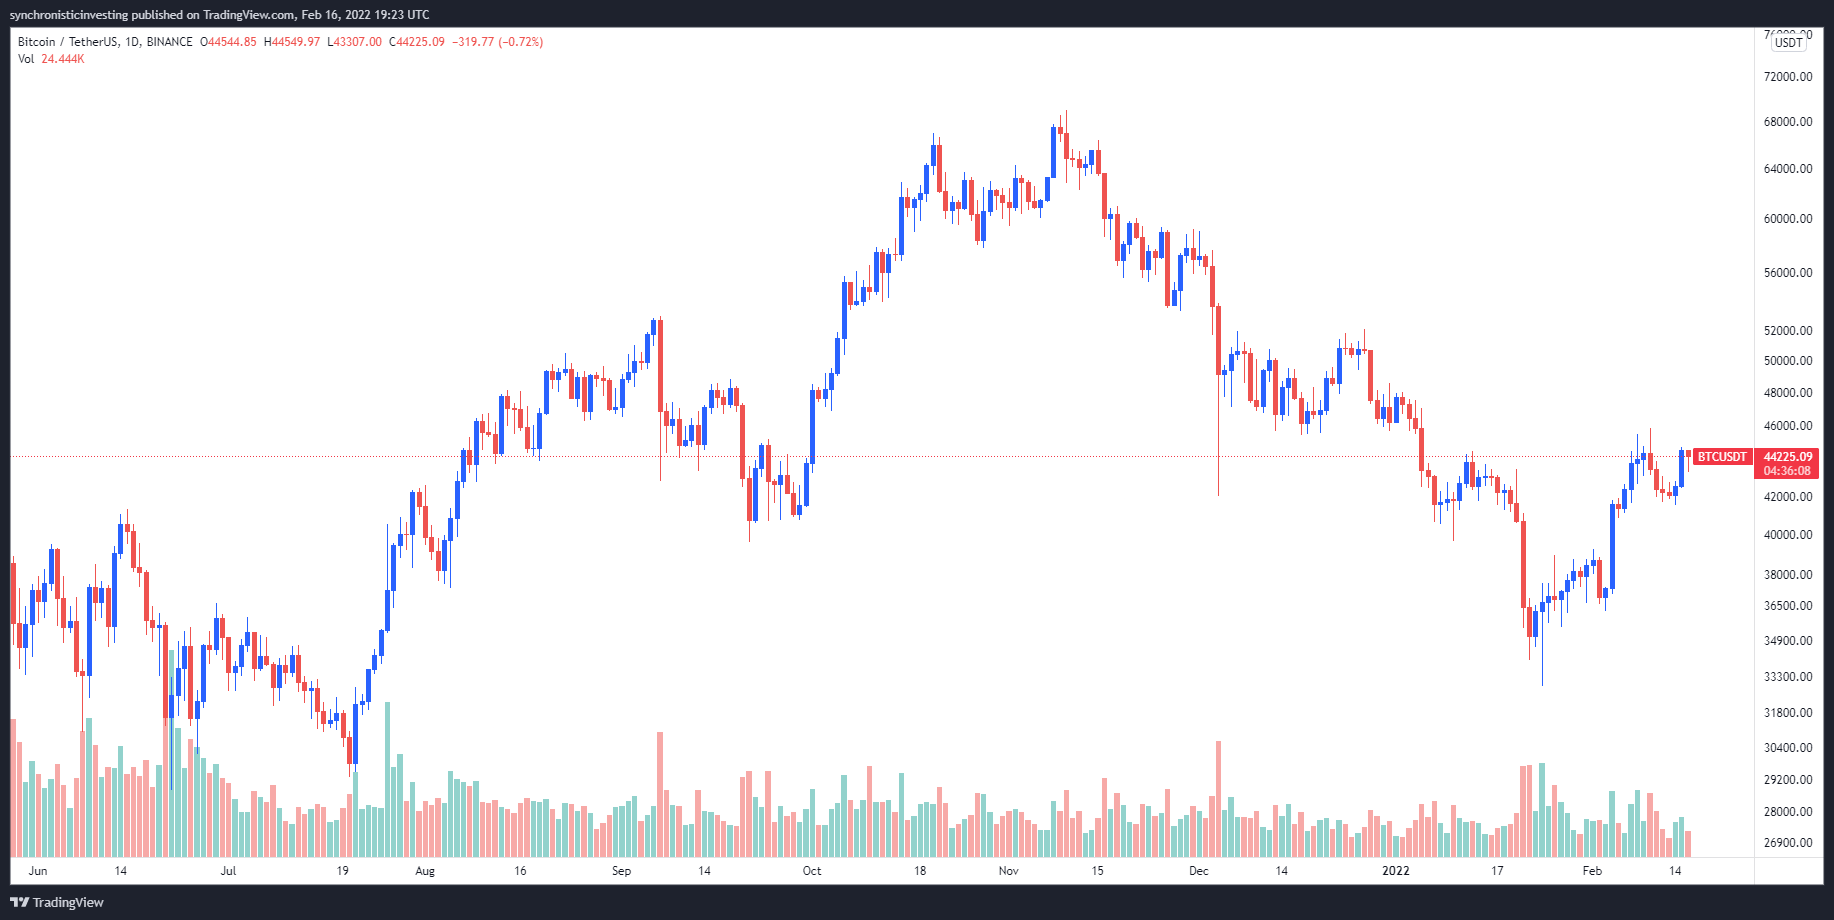
BTC/USDT 1-day chart. Source: TradingView
Here’s a survey of what several analysts in the market are keeping an eye on moving forward as global issues from inflation to war continue to make their presence felt in the cryptocurrency market.
On-Balance Volume shows a bullish reversal
Insight into what may lie ahead for Bitcoin based on its On-Balance Volume (OBV), which is a momentum indicator that uses volume flow to predict changes in the price of an asset, was provided by market analyst and pseudonymous Twitter user ‘IncomeSharks’ who posed the following chart highlighting the bullish reversal in the indicator.
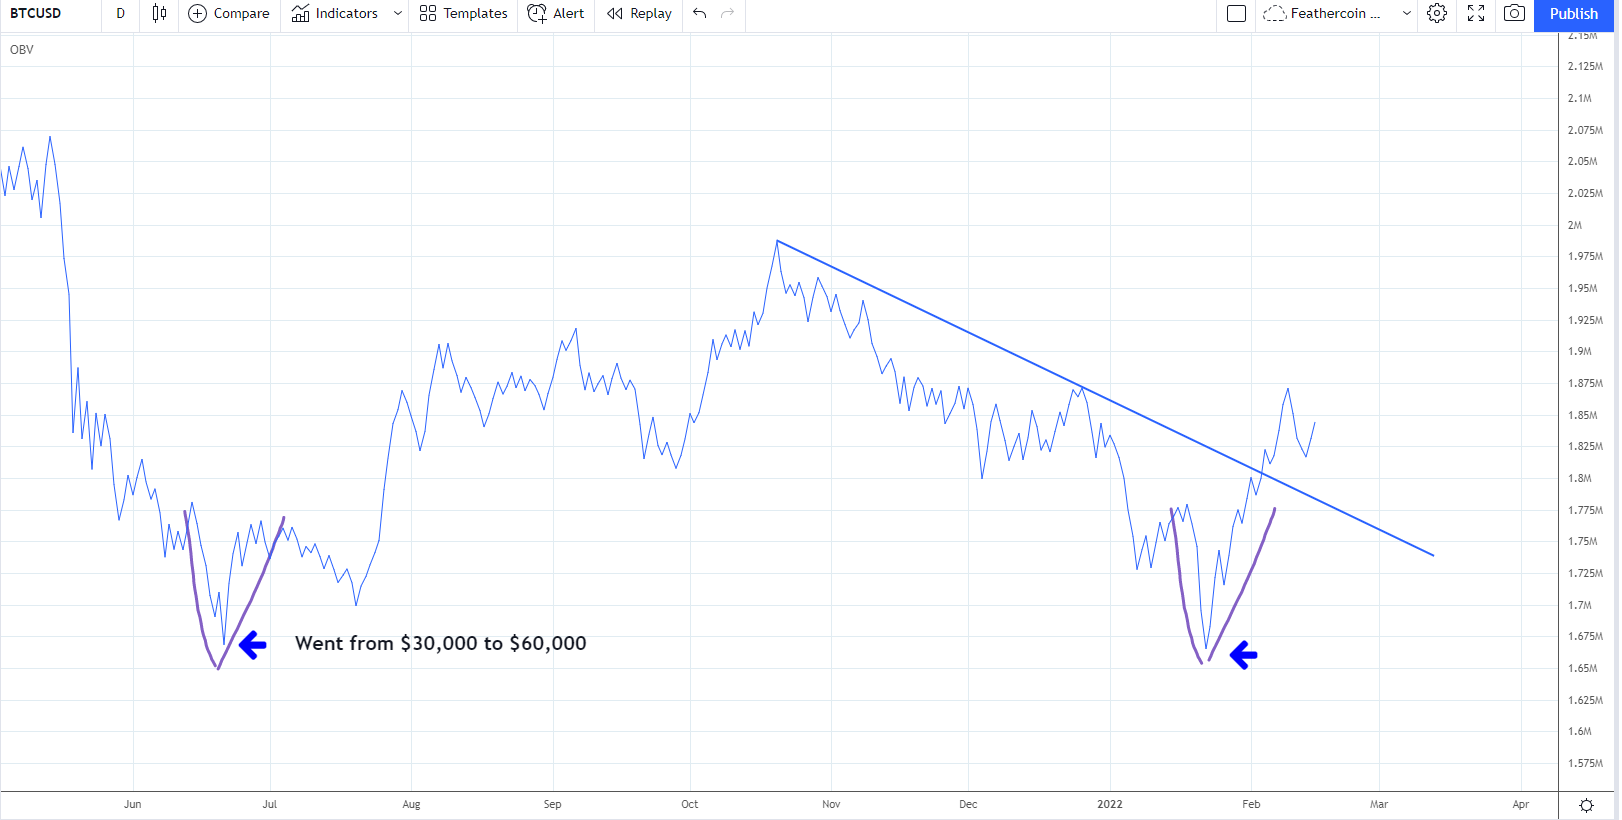
BTC/USD 1-day OBV chart. Source: Twitter
The analyst said,
“And people telling me we aren't bottomed out... This is almost a more bullish move than last time we went from $30,000 to $60,000. Double bottom, very sharp bullish V spike. Price action is just noise and people are listening too much to Crypto Twitter.”
Bullish if BTC holds $42,000
A similar bullish take on the current price action for BTC was offered by analyst and pseudonymous Twitter user ‘CredibleCrypto’, who posted the following lower time frame chart that indicates Bitcoin has more room to run.
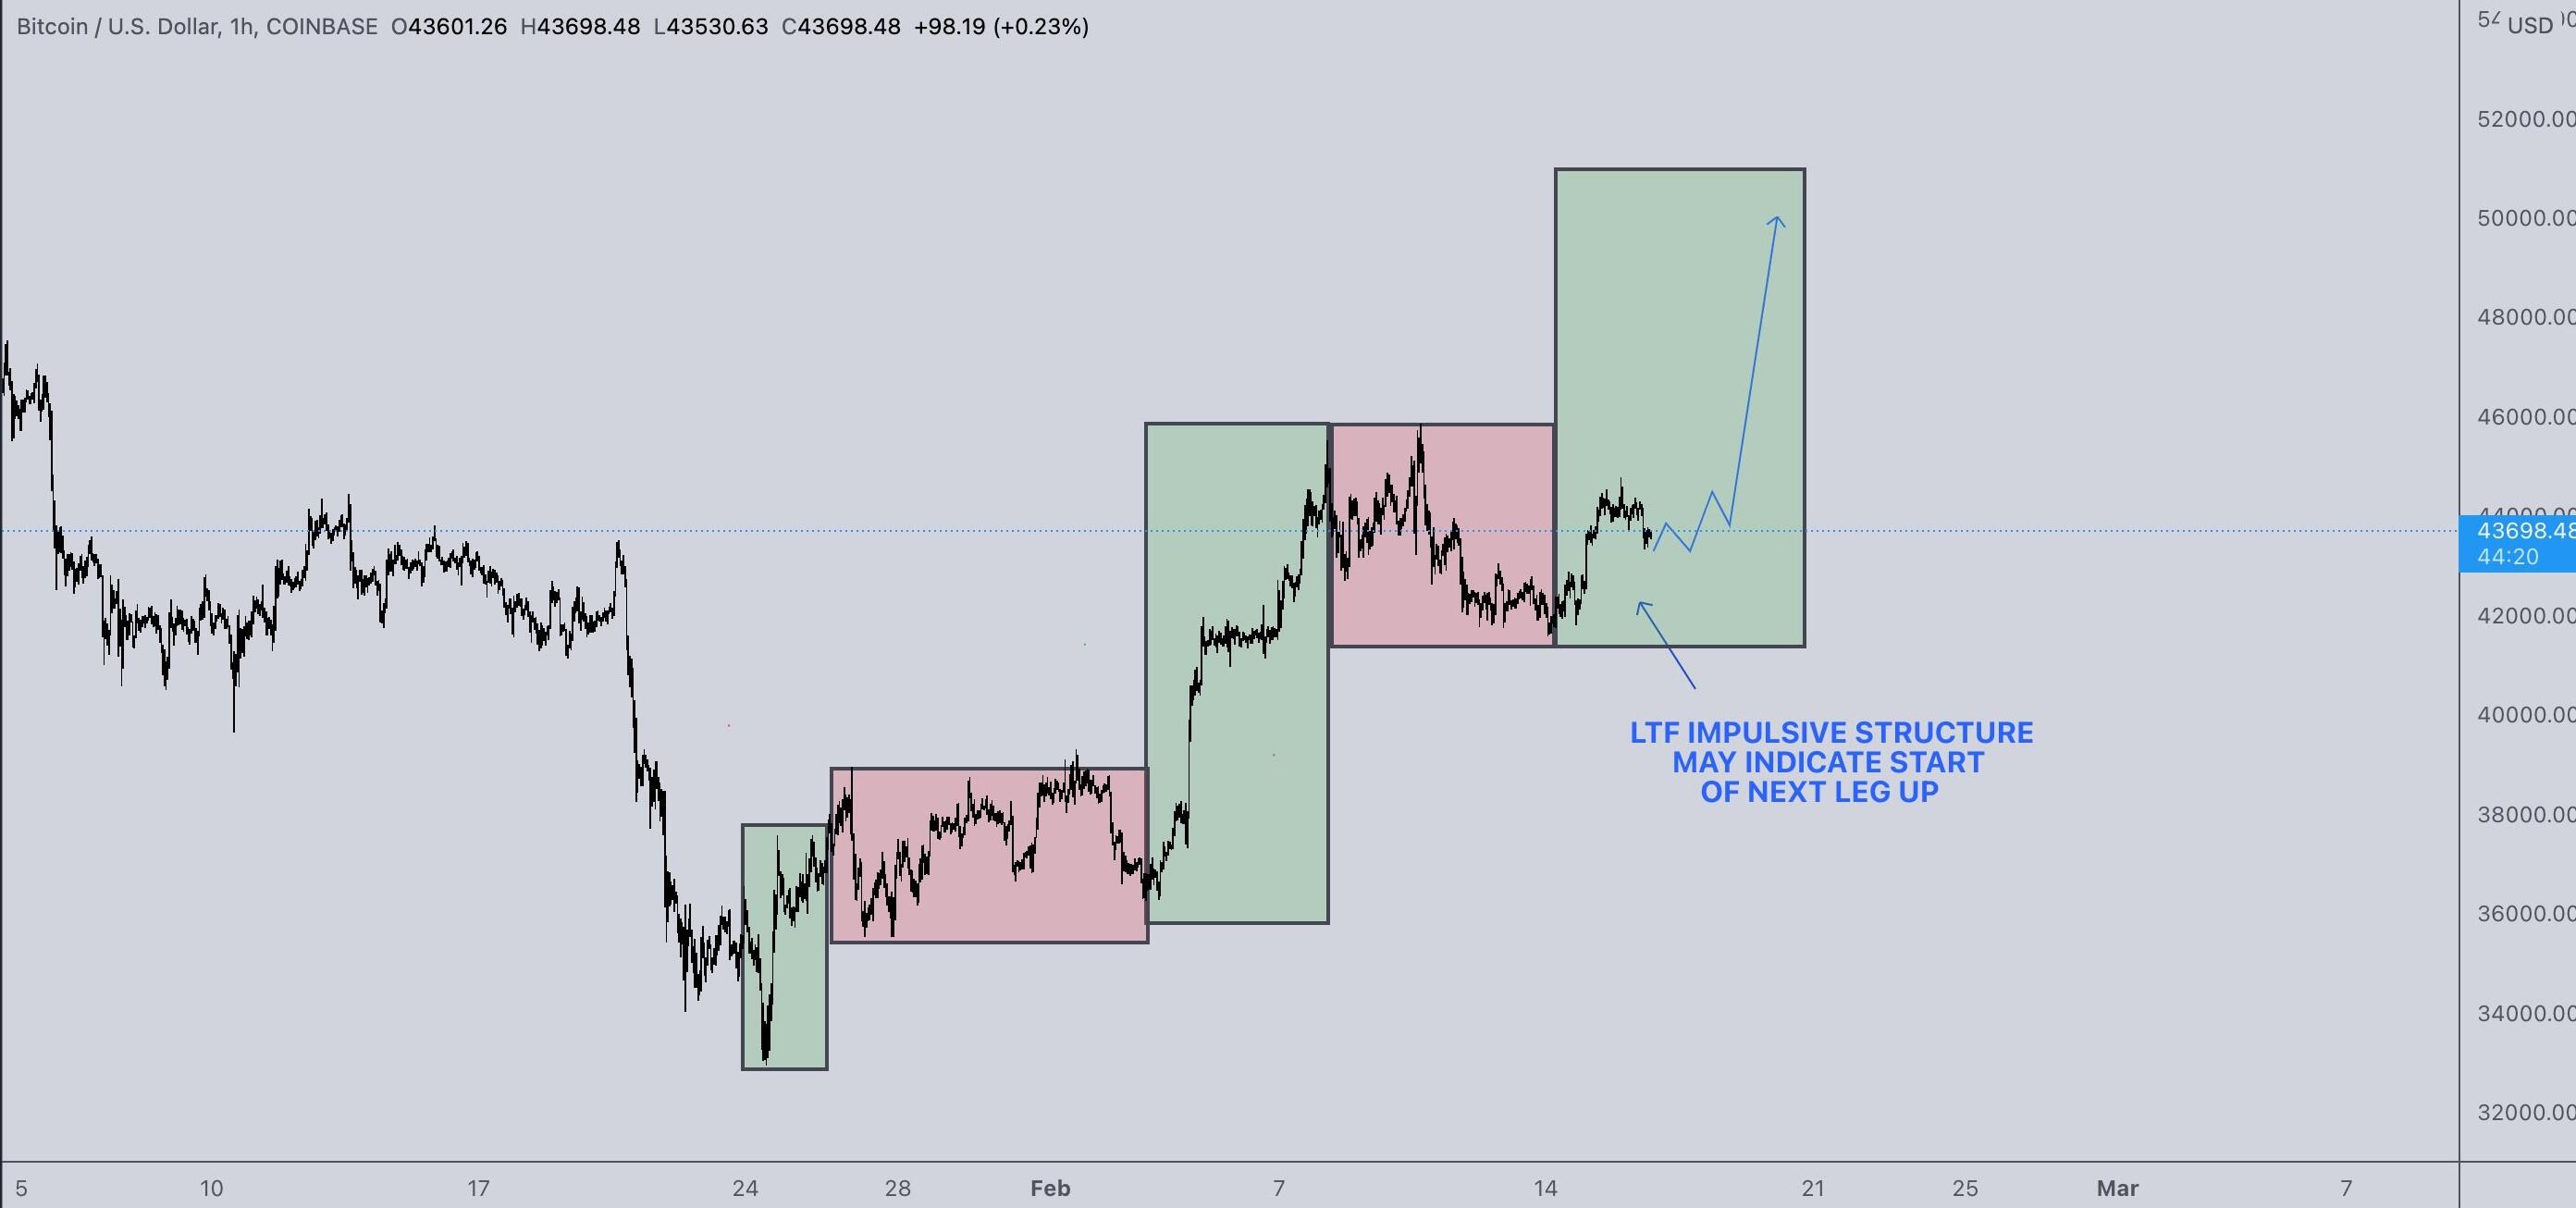
BTC/USD 1-hour chart. Source: Twitter
CredibleCrypto said,
Strong moves up, shallow pullbacks, continuation. As long as $42,000 holds LTF wave structure indicates we are likely starting the next push up.
Bitcoin price could increase by 25%
A final bit of analysis that also took BTC momentum into consideration was offered by market analyst and Twitter user Caleb Fransen, who posted the following chart that included the Williams%R oscillator, a momentum indicator that measures overbought and oversold levels.
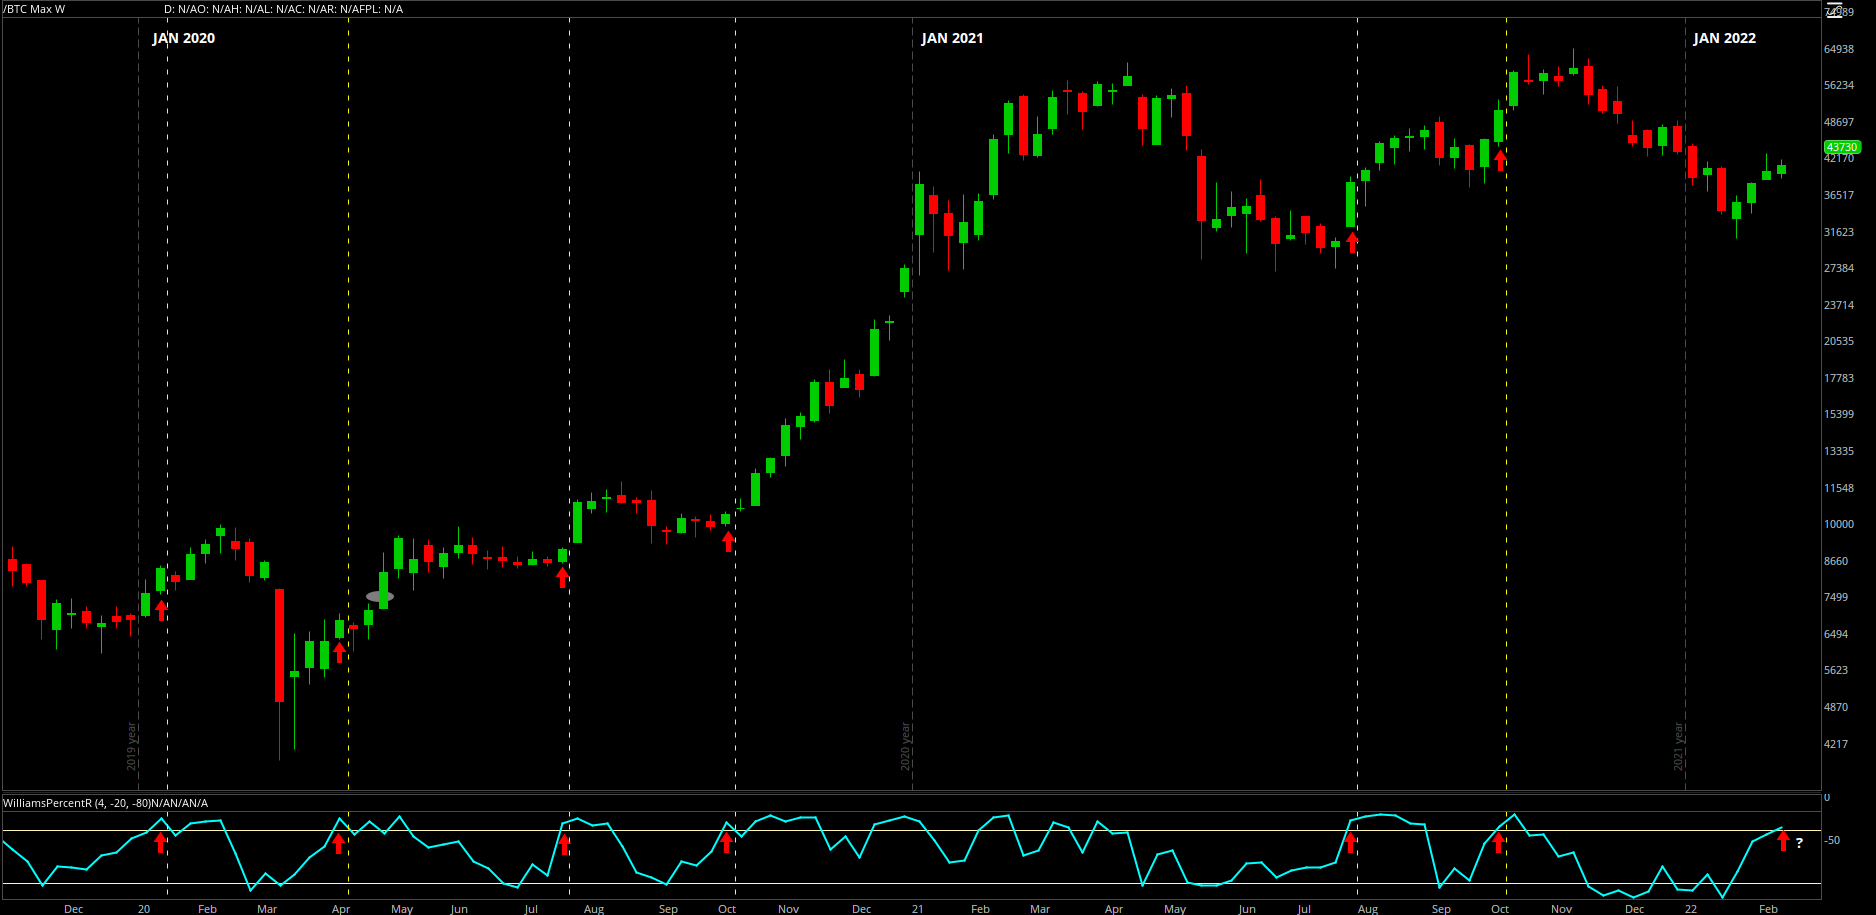
BTC/USD 1-week chart. Source: Twitter
According to Fransen, “when there is a full oscillation from “oversold” to "overbought", it indicates a momentum thrust,” an event that has occurred six times for Bitcoin since January 2020.
Fransen said,
After the weekly thrust, the average 1-month return is +25%. The Williams%R is attempting to complete the 4-week momentum thrust right now. I'll be very optimistic if (big "if") Bitcoin can secure a strong weekly close.
The overall cryptocurrency market cap now stands at $1.999 trillion and Bitcoin’s dominance rate is 42%.
Author

Cointelegraph Team
Cointelegraph
We are privileged enough to work with the best and brightest in Bitcoin.