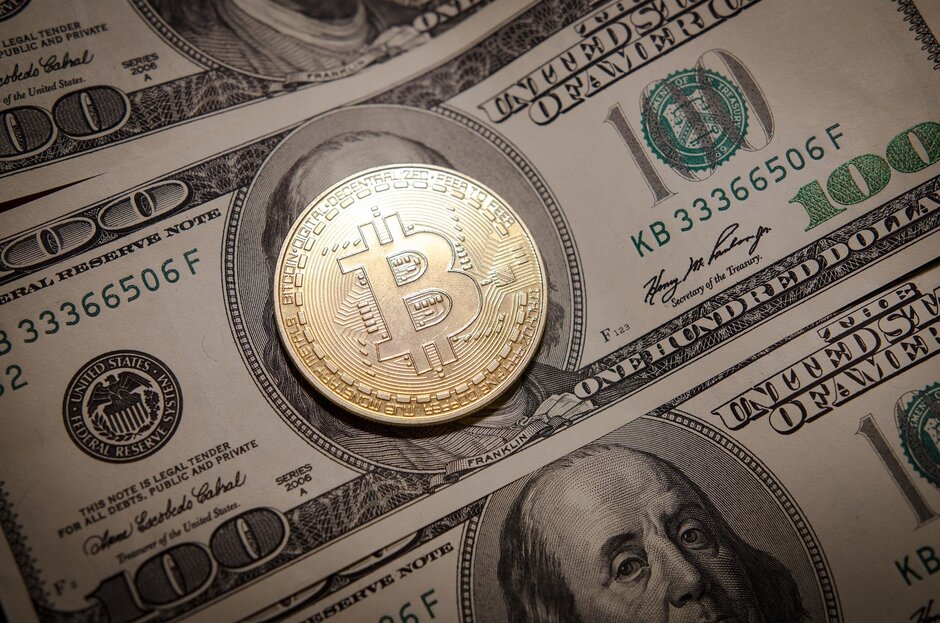
Bitcoin price rises as Dell's founder and CEO again tweets about Bitcoin
- Bitcoin price is breaking above the falling wedge pattern, signaling a potential bullish move.
- Michael Dell, Dell's founder and CEO, again tweets about Bitcoin.
- On-chain data shows miners' selling activity is decreasing, suggesting bullish momentum.
- BTC shows positive funding rates and increasing open interest.
Bitcoin (BTC) price is breaking above the falling wedge pattern on Monday and trades 1% up at the $63,400 level. On-chain data shows a decline in miners' selling activity, positive funding rates, and increasing open interest, suggesting potential price gains in the coming days.
Daily digest market movers: Bitcoin miners' selling pressure decreases
- According to CryptoQuant data, Bitcoin miners' selling activity has reduced compared to the previous week. The average daily rate was 8,592.14 BTC last week, contrasting sharply with the average daily rate of 1,849 BTC observed on Monday.
- Additionally, the volume of the OTC Desk used by miners for selling purposes was piling up as they could only recently find a buyer, but on June 29, the volume of the OTC Desk was all consumed. Someone has likely shown up to purchase the Bitcoin.
%2520-%2520All%2520Miners%2C%2520All%2520Exchanges%2520(2)-638554216206922772.png&w=1536&q=95)
Bitcoin Miner to Exchange chart

Bitcoin Total OTC Desk Balance chart
- Michael Dell, Dell's founder and CEO, sparked engagement on Saturday by initiating a Twitter poll where respondents chose between "AI," "Bitcoin," "love and relationships," and "none of the above" as the most important thing. With "Bitcoin" emerging as the preferred option, receiving 43.1% of the 64,035 votes, Dell's interaction underscores Bitcoin's ongoing societal intrigue. Amidst debates on AI, love, and innovation, the poll on X reveals Bitcoin's enduring allure among digital-age enthusiasts, especially within the crypto-centric community. Conducting a similar poll on a different platform would likely produce contrasting outcomes, reflecting varied user demographics and interests.
The most important thing
— Michael Dell (@MichaelDell) June 28, 2024
- According to CryptoQuant data, Bitcoin funding rates periodically compensate traders based on the variance between perpetual contract markets and spot prices. Positive rates signify a prevalence of long positions and a willingness to pay short traders. In contrast, negative rates indicate dominance by short positions with payments to long traders.
- As in the BTC case, the funding rates are positive and have risen from 0.0093 to 0.0098 in the last three days.
This 5.37% rise in Funding Rates indicates that long-position traders are dominant and are willing to pay funding to short traders.
Additionally, Coinglass BTC's long-to-short ratio data in the last 24 hours shows that 51.54% of positions were long compared to 48.46% of short positions.

Bitcoin Funding rates chart

Bitcoin Long to Short Ratio chart
- Data from CoinGlass shows that the future's open interest in Bitcoin at exchanges is increasing. The Open Interest indicates the total number of outstanding derivative contracts that have not been settled (offset by delivery) and whether money flows into the contract are increasing or decreasing.
- Increasing Open Interest represents new or additional money coming into the market and new buying happening, which is a bullish trend. When Open Interest decreases, it is usually a sign that the market is liquidating, more investors are leaving, and the current price trend is ending.
The graph shows that BTC's Open Interest increased from $30.97 billion on June 29 to 32.11 billion on Monday, indicating that new or additional money is entering the market and new buying is happening. A similar trend was seen in the bullish price movement from May 20 to May 21.

Bitcoin Open Interest chart
Technical analysis: BTC is breaking above the falling wedge
Bitcoin price is breaking above the falling wedge on Monday and is trading up by 1% at the $63,400 level.
If BTC's price closes above the $63,956 daily resistance level, it could rise 5% to retest its next weekly resistance at $67,147.
The Relative Strength Index (RSI) and the Awesome Oscillator in the daily chart are below their neutral levels of 50 and zero. If bulls are indeed returning, then both momentum indicators must regain their positions above their respective neutral levels.
If the bulls are aggressive and the overall crypto market outlook is positive, BTC could extend an additional rally of 6% to revisit its weekly resistance at $71,280.

BTC/USDT daily chart
However, if BTC closes below the $58,375 level and forms a lower low in the daily time frame, it could indicate that bearish sentiment persists. Such a development may trigger a 3% decline in Bitcoin's price, to revisit its low of $56,522 from May 1.
Crypto ETF FAQs
An Exchange-Traded Fund (ETF) is an investment vehicle or an index that tracks the price of an underlying asset. ETFs can not only track a single asset, but a group of assets and sectors. For example, a Bitcoin ETF tracks Bitcoin’s price. ETF is a tool used by investors to gain exposure to a certain asset.
Yes. The first Bitcoin futures ETF in the US was approved by the US Securities & Exchange Commission in October 2021. A total of seven Bitcoin futures ETFs have been approved, with more than 20 still waiting for the regulator’s permission. The SEC says that the cryptocurrency industry is new and subject to manipulation, which is why it has been delaying crypto-related futures ETFs for the last few years.
Bitcoin spot ETF has been approved outside the US, but the SEC is yet to approve one in the country. After BlackRock filed for a Bitcoin spot ETF on June 15, the interest surrounding crypto ETFs has been renewed. Grayscale – whose application for a Bitcoin spot ETF was initially rejected by the SEC – got a victory in court, forcing the US regulator to review its proposal again. The SEC’s loss in this lawsuit has fueled hopes that a Bitcoin spot ETF might be approved by the end of the year.
Author

Manish Chhetri
FXStreet
Manish Chhetri is a crypto specialist with over four years of experience in the cryptocurrency industry.


