![]() Cointelegraph Team
Cointelegraph Team
Cointelegraph
BTC bulls are holding $20,000, but most traders are confident that the price will remain range-bound for at least six more months.
Trading across the cryptocurrency market was relatively subdued on July 5 as the ecosystem continues to digest the fallout from the Three Arrows Capital scandal and Voyager Digital announcing that it has filed for Chapter 11 bankruptcy protection.
Data from Cointelegraph Markets Pro and TradingView shows that the price of Bitcoin (BTC) has spent the day oscillating around the $20,000 support level, ranging from a low of $19,775 to an intraday high of $20,480 on $25.48 billion in trading volume.
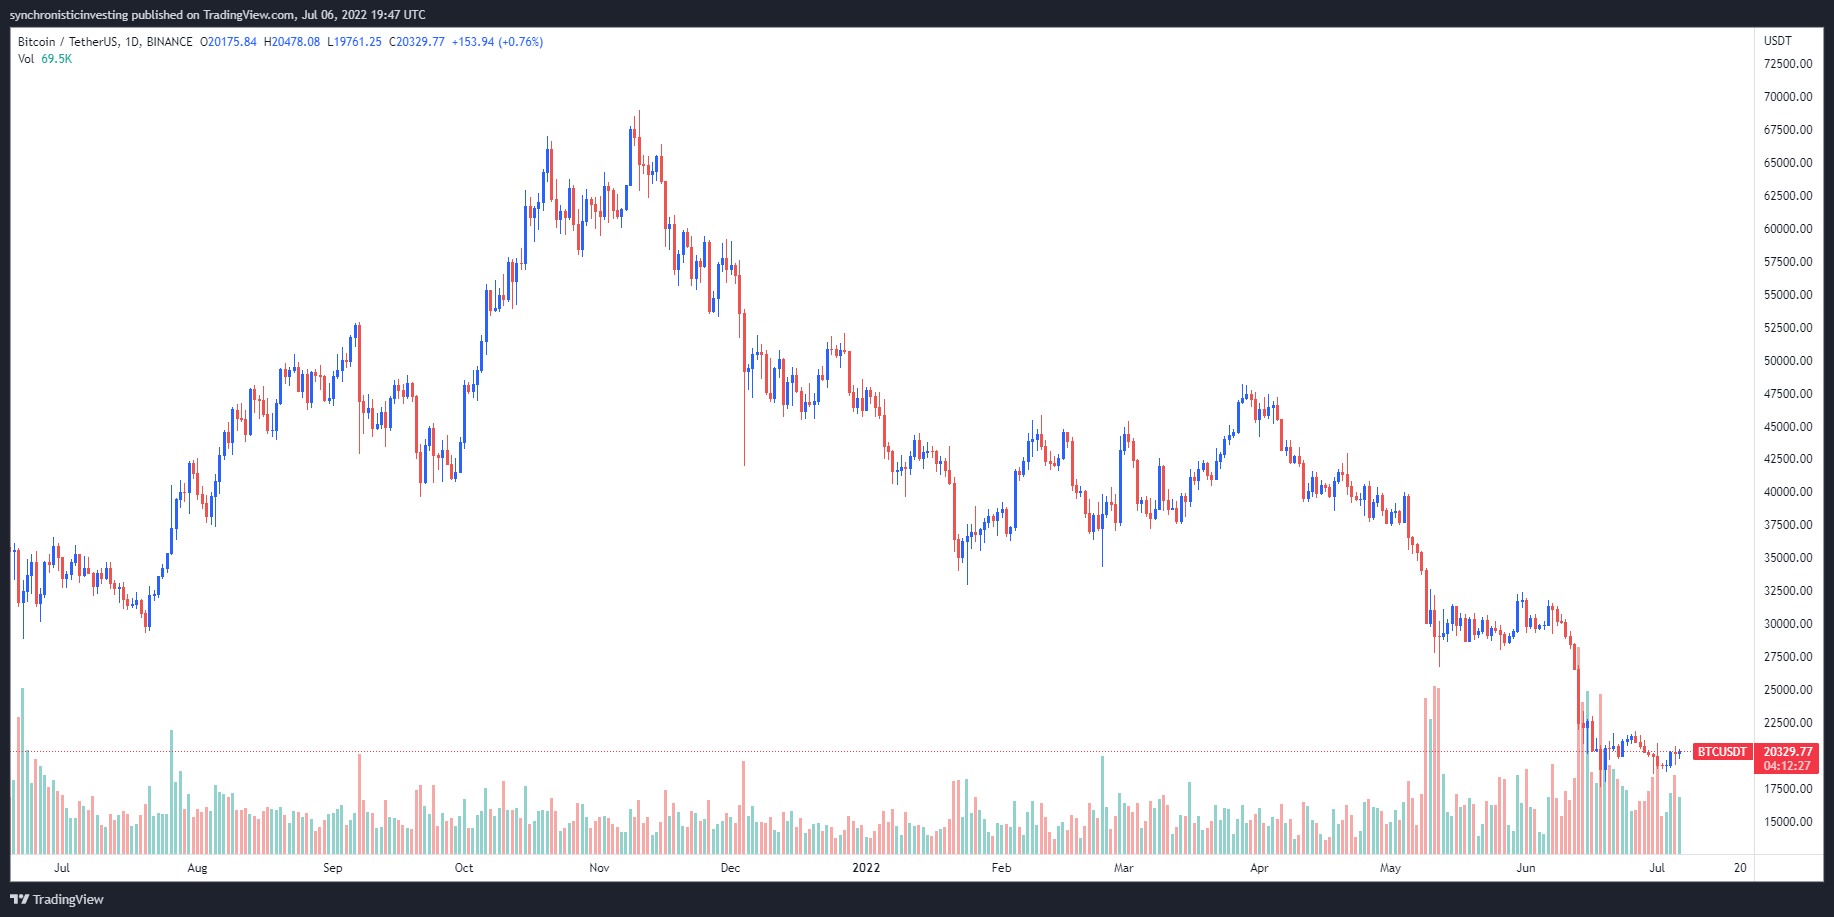
BTC/USDT 1-day chart. Source: TradingView
Here’s a look at what several analysts are saying about what could come next for Bitcoin and what support and resistance levels to keep an eye on in the event of a sharp move in price.
Watch the repeating pennant pattern
A noticeable pattern on the Bitcoin chart prior to the pullbacks that have occurred since November 2021 was pointed out by crypto analyst and pseudonymous Twitter user Moustache, who posted the following chart displaying the similarities between each drawdown.
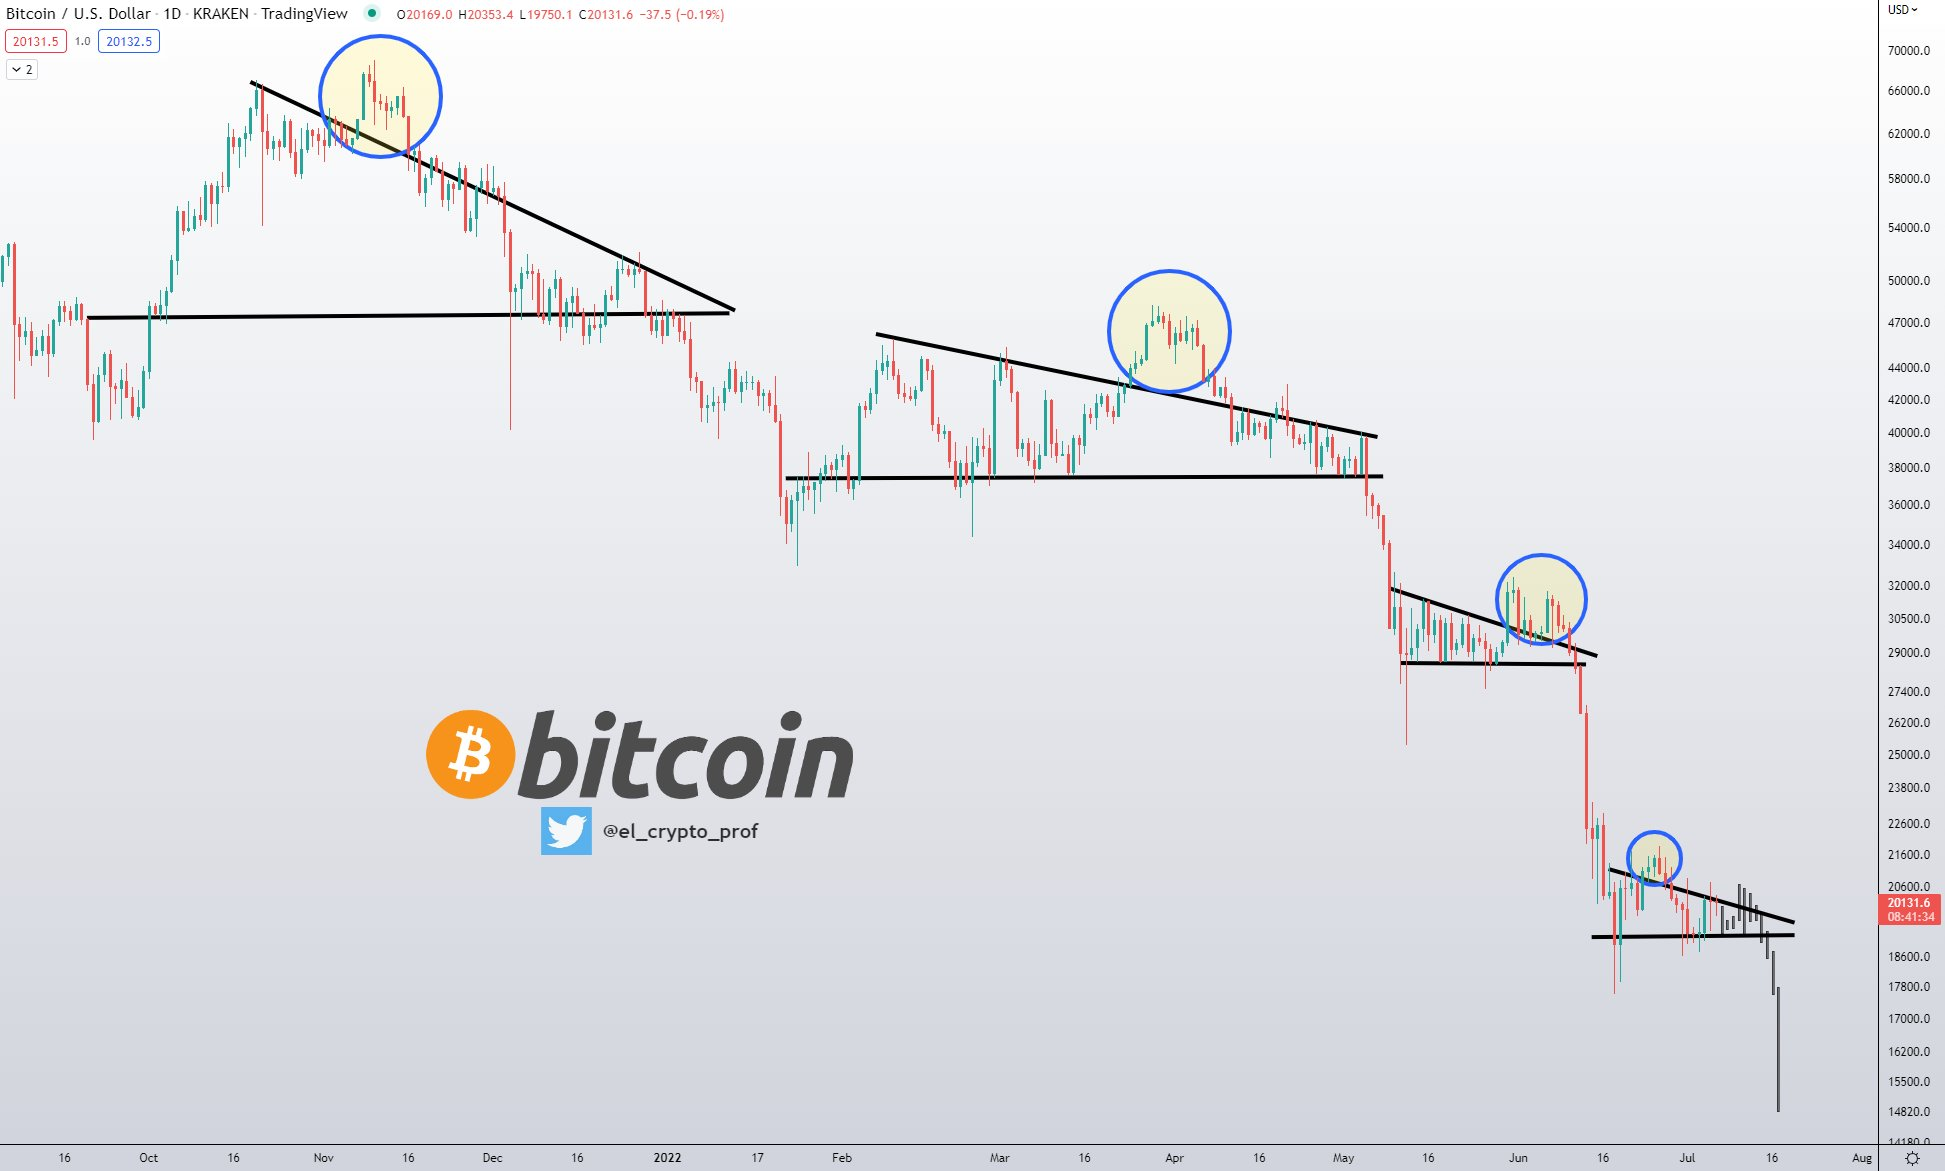
BTC/USD 1-day chart. Source: Twitter
Moustache said,
$BTC has done the same pattern every time, but each descending triangle has gotten smaller and smaller? Another bearish breakout and the target would be between $14,000 and $16,000.
Noted market analyst Peter Brandt also recently highlighted the repeating pennant pattern on the Bitcoin chart, but stopped short of saying which way the price could move once the formation completes.
When it looks like a pennant and acts like a pennant it is often a pennant $BTC pic.twitter.com/O7RtnvFSp0
— Peter Brandt (@PeterLBrandt) July 5, 2022
Address count grows as the market looks for a bottom
Lately, one of the most popular topics of conversation on crypto Twitter has been centered around trying to predict the bottom in Bitcoin price.
According to cryptocurrency research firm Delphi Digital, Bitcoin has now closed below its 200 weekly average for four consecutive weeks, a development that has historically “marked previous market bottoms.”
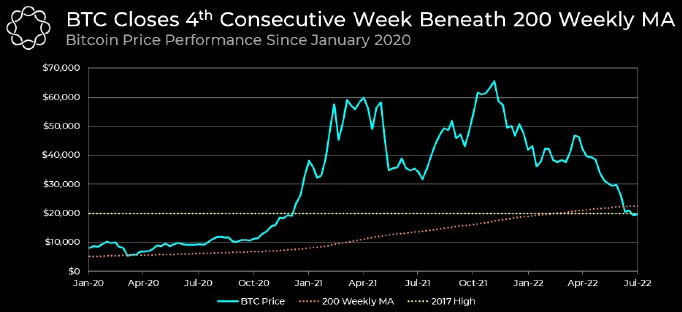
Bitcoin price performance since January 2020. Source: Delphi Digital
As for whether or not Bitcoin traders should expect a rapid recovery, Delphi Digital noted that “this is the longest BTC has remained below its 200 weekly average” and highlighted the fact that “Bitcoin’s weekly correlation coefficient continues to remain inversely related to the US Dollar as it hit a 17-month low of -0.77.”
While a strong dollar suggests that Bitcoin price will continue to struggle alongside other assets, Delphi Digital highlighted one encouraging development that suggests BTC adoption continues to grow.
Delphi Digital said,
With prices continuing to fall, the number of BTC addresses accumulating BTC continues to rise. Addresses holding at least one BTC have reached a new all-time high of 877,501.
Some traders predict chop for the remainder of 2022
A macro look at what the past performance of Bitcoin suggests about its future was provided by market analyst and pseudonymous Twitter user KALEO, who posted the following chart outlining previous market cycles.
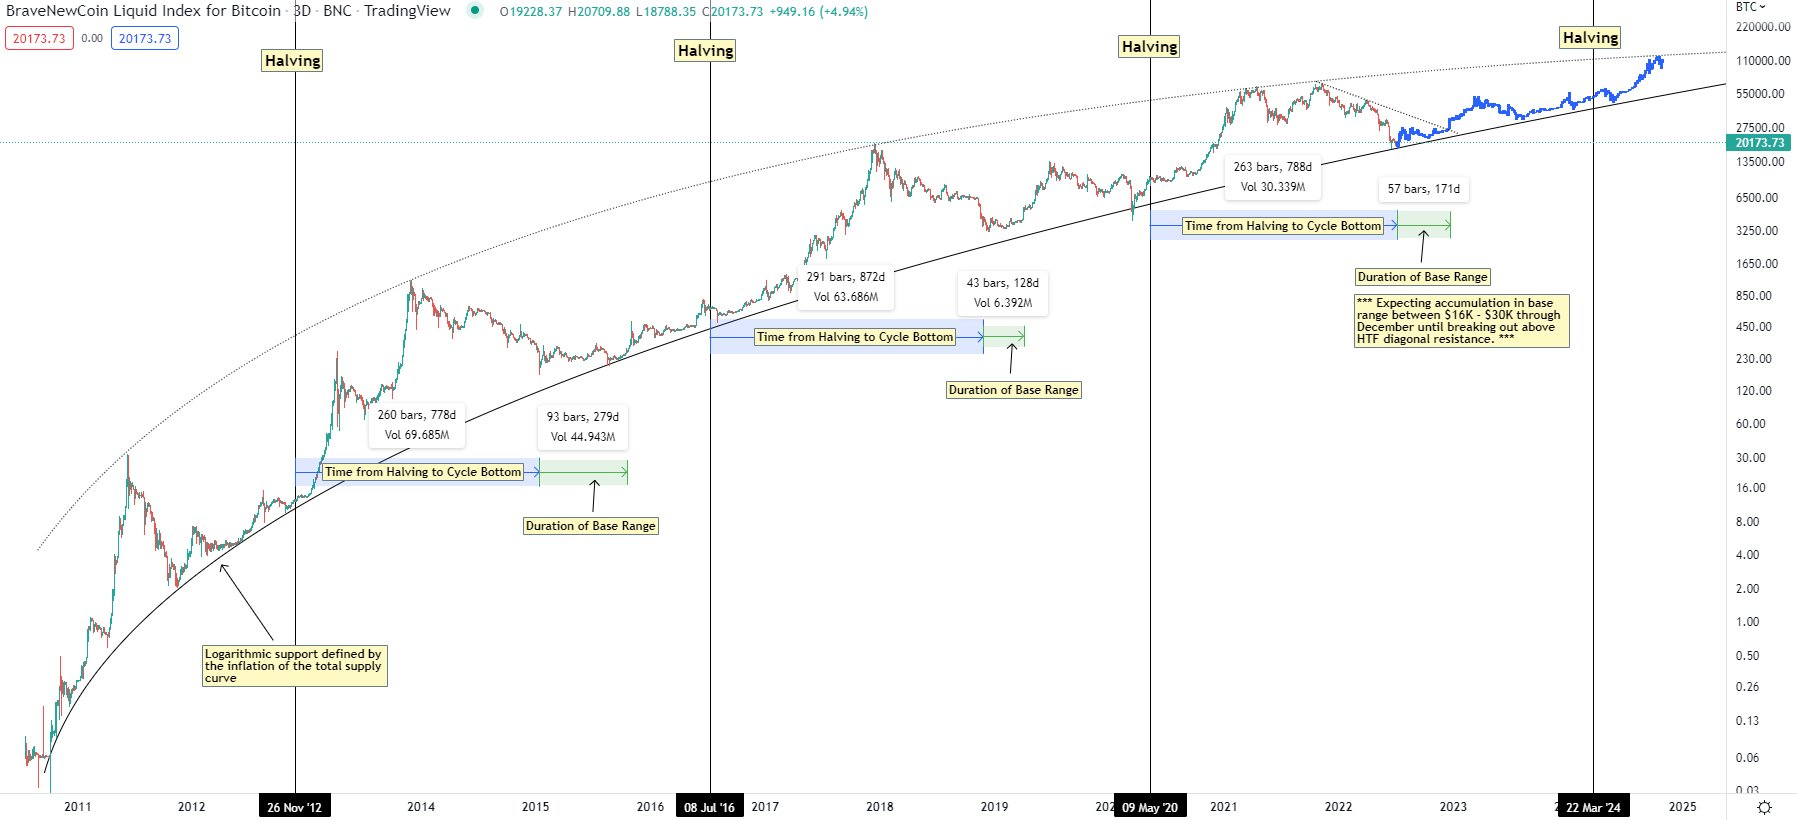
BTC/USD 3-day chart. Source: Twitter
Based on the chart and the predicted path provided, Kaleo suggested that the market will continue to trade sideways for the foreseeable future and will be “defined by a crab market saying above HTF logarithmic support.
Kaleo said,
Most likely path from here is seeing a base range between $16K - $30K established, that eventually resolves around December when price finally breaks above HTF diagonal resistance.
The overall cryptocurrency market cap now stands at $916 billion and Bitcoin’s dominance rate is 42.5%.
Information on these pages contains forward-looking statements that involve risks and uncertainties. Markets and instruments profiled on this page are for informational purposes only and should not in any way come across as a recommendation to buy or sell in these assets. You should do your own thorough research before making any investment decisions. FXStreet does not in any way guarantee that this information is free from mistakes, errors, or material misstatements. It also does not guarantee that this information is of a timely nature. Investing in Open Markets involves a great deal of risk, including the loss of all or a portion of your investment, as well as emotional distress. All risks, losses and costs associated with investing, including total loss of principal, are your responsibility. The views and opinions expressed in this article are those of the authors and do not necessarily reflect the official policy or position of FXStreet nor its advertisers.
Recommended Content
Editors’ Picks

Polygon joins forces with WSPN to expand stablecoin adoption
WSPN, a stablecoin infrastructure company based in Singapore, has teamed up with Polygon Labs to make its stablecoin, WUSD, more useful in payment and decentralized finance.

Coinbase envisages listing of more meme coins amid regulatory optimism
Donald Trump's expected return to the White House creates excitement in the cryptocurrency sector, especially at Coinbase, the largest US-based crypto exchange. The platform is optimistic that the new administration will focus on regulatory clarity, which could lead to more token listings, including popular meme coins.

Cardano's ADA leaps to 2.5-year high of 90 cents as whale holdings exceed $12B
As Bitcoin (BTC) gets closer to the $100,000 mark for the first time — it crossed $99,000 earlier Friday — capital is rotating into alternative cryptocurrencies, creating a buzz in the broader crypto market.
Shiba Inu holders withdraw 1.67 trillion SHIB tokens from exchange
Shiba Inu trades slightly higher, around $0.000024, on Thursday after declining more than 5% the previous week. SHIB’s on-chain metrics project a bullish outlook as holders accumulate recent dips, and dormant wallets are on the move, all pointing to a recovery in the cards.

Bitcoin: Rally expected to continue as BTC nears $100K
Bitcoin (BTC) reached a new all-time high of $99,419, just inches away from the $100K milestone and has rallied over 9% so far this week. This bullish momentum was supported by the rising Bitcoin spot Exchange Traded Funds (ETF), which accounted for over $2.8 billion inflow until Thursday. BlackRock and Grayscale’s recent launch of the Bitcoin ETF options also fueled the rally this week.

Best Forex Brokers with Low Spreads
VERIFIED Low spreads are crucial for reducing trading costs. Explore top Forex brokers offering competitive spreads and high leverage. Compare options for EUR/USD, GBP/USD, USD/JPY, and Gold.