Bitcoin price holds $60,000 level as on-chain data shows positive bias
- Bitcoin price rises for a second consecutive day, but remains within its broad consolidation trend between $57,000 and $62,000.
- Coinglass's long-to-short ratio stands above one, suggesting a mild bullish sentiment.
- On-chain data shows that wallets between 100 and 1,000 BTC are accumulating.

Bitcoin (BTC) rises on Tuesday for a second consecutive day, popping above $61,400 during the Asian session, as market sentiment improves and amid encouraging signs from on-chain data. However, the largest crypto asset by market capitalization remains in a broad consolidation phase as it has traded between $57,000 and $62,000 for the past ten days, struggling to break resistance in the upper range of the band.
Daily digest market movers: Bitcoin whales add to holdings
- Santiment data shows that Bitcoin whale wallets holding between 100 and 1,000 BTC have accumulated 94,700 BTC in the past six weeks. This represents a 2.44% rise, indicating that this cohort of stakeholders is loading up despite the recent fall in Bitcoin's price from $70,000 to $49,000 from the end of July to early August, which has shaken many traders out of crypto.

Bitcoin 100 to 1000 holdings chart
- According to Coinglass data, US spot Bitcoin ETFs experienced a mild inflow of $62.10 million on Monday. Net flows can help gauge investors' sentiment towards Bitcoin, but when these are small – like this at the start of this week so far – they are less significant, considering that the total Bitcoin reserves held by the 11 US spot Bitcoin ETFs are at $54.25 billion. Still, ETFs are accumulating three straight days of inflows.


Bitcoin Spot ETF Net Inflow (USD) chart
- Coinglass's long-to-short ratio stands at 1.11. This ratio suggests a mild bullish sentiment in the market as the number above one suggests that more trades anticipate the price of Bitcoin will rise.
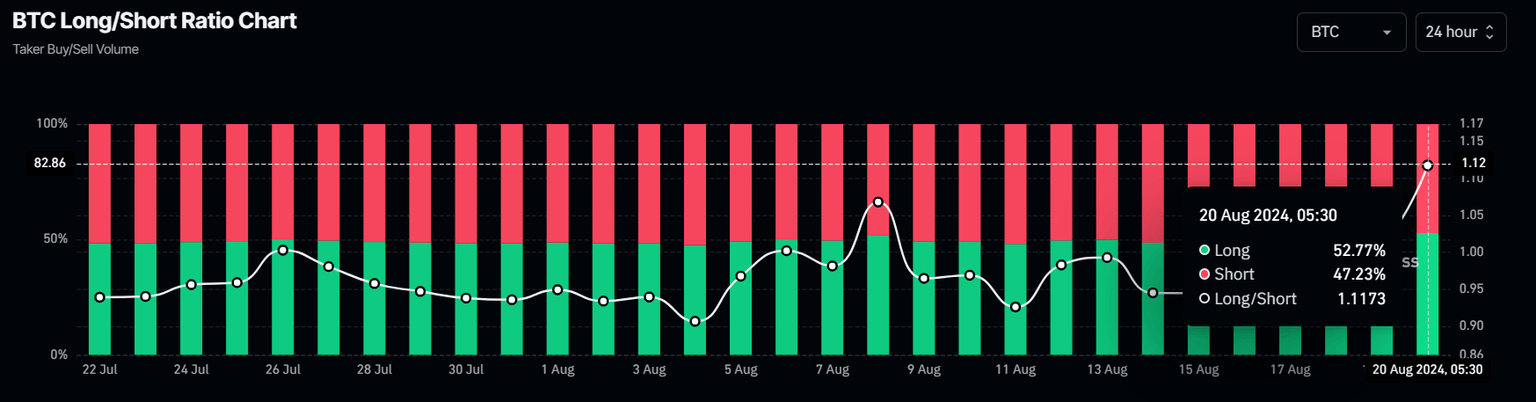
Bitcoin long-to-short ratio chart
- CryptoQuant's Inter-exchange Flow Pulse (IFP) index measures Bitcoin flows on spot and derivative exchanges. These flows provide insights into market trends. A rise in this index indicates more Bitcoin is flowing into derivative exchanges, which is generally considered a sign of a bullish phase. On the contrary, a fall in the index suggests Bitcoin is flowing out of derivative exchanges, a sign of a bearish phase. In BTC's case, the index trades above the 90-day simple moving average, indicating that bulls are regaining strength.
%2520(1)-638597473622130591.png&w=1536&q=95)
Bitcoin Inter-exchange Flow Pulse chart
- Japanese public company Metaplanet bought over $3.4 million worth of Bitcoin per August 20 notice. This follows Metaplanet's recent decision to adopt Bitcoin as a reserve asset to address risks related to Japan's significant debt and Japanese Yen (JPY) volatility. Metaplanet's move could pave the way for broader adoption of Bitcoin and cryptocurrencies, among other companies, and its total holding is 303.09 BTC worth $18.42 million.
*Metaplanet purchases additional 57.27 $BTC* pic.twitter.com/jvk3heTCOA
— Metaplanet Inc. (@Metaplanet_JP) August 20, 2024
Technical analysis: BTC nears key resistance
Bitcoin price continues to consolidate between $57,115 and $62,066, the Fibonacci retracement levels of 38.2% and 61.8%, respectively, drawn from the high on July 29 to the low on August 5. On Tuesday, it trades slightly higher by 2.33% to $60,828 at the time of writing.
Suppose BTC rises back to the 61.8% Fibonacci retracement at $62,066. In that case, it may find some resistance at this level, as it aligns with the previously breached trendline and the 100-day Exponential Moving Average of around $62,217, making it a key resistance zone.
If it does not surpass $62,066, it could drop to $57,115 before potentially declining by 19% to revisit the $49,917 daily support level.
On the daily chart, the Relative Strength Index (RSI) is flipping above its neural level of 50, and the Awesome Oscillator (AO) still trades below its neutral level of zero. For bearish momentum to sustain, both indicators must remain below their neutral levels.
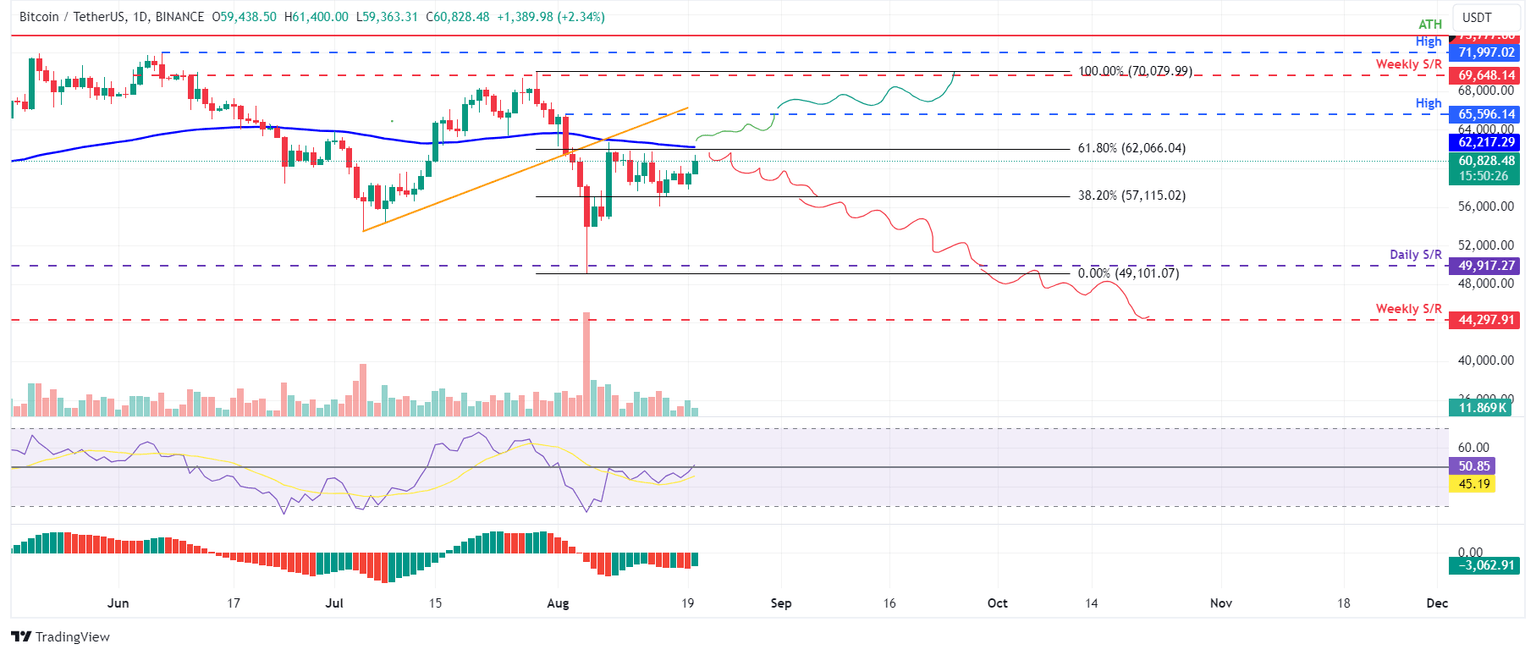
BTC/USDT daily chart
On the other hand, if Bitcoin's price can close above $62,066, a rise towards the August 2 high of $65,596 would be on the cards as it would set a higher high on the daily chart. This could lead to a further 6% price increase to test the weekly resistance at $69,648.
Bitcoin, altcoins, stablecoins FAQs
Bitcoin is the largest cryptocurrency by market capitalization, a virtual currency designed to serve as money. This form of payment cannot be controlled by any one person, group, or entity, which eliminates the need for third-party participation during financial transactions.
Altcoins are any cryptocurrency apart from Bitcoin, but some also regard Ethereum as a non-altcoin because it is from these two cryptocurrencies that forking happens. If this is true, then Litecoin is the first altcoin, forked from the Bitcoin protocol and, therefore, an “improved” version of it.
Stablecoins are cryptocurrencies designed to have a stable price, with their value backed by a reserve of the asset it represents. To achieve this, the value of any one stablecoin is pegged to a commodity or financial instrument, such as the US Dollar (USD), with its supply regulated by an algorithm or demand. The main goal of stablecoins is to provide an on/off-ramp for investors willing to trade and invest in cryptocurrencies. Stablecoins also allow investors to store value since cryptocurrencies, in general, are subject to volatility.
Bitcoin dominance is the ratio of Bitcoin's market capitalization to the total market capitalization of all cryptocurrencies combined. It provides a clear picture of Bitcoin’s interest among investors. A high BTC dominance typically happens before and during a bull run, in which investors resort to investing in relatively stable and high market capitalization cryptocurrency like Bitcoin. A drop in BTC dominance usually means that investors are moving their capital and/or profits to altcoins in a quest for higher returns, which usually triggers an explosion of altcoin rallies.
Author

Manish Chhetri
FXStreet
Manish Chhetri is a crypto specialist with over four years of experience in the cryptocurrency industry.


