Bitcoin Price Forecast: BTC/USD stage comeback but hampered by strong stack of resistance – Confluence Detector
- BTC/USD dropped below $9,200 this Monday.
- Daily confluence detector shows a strong resistance stack between $9,200–$9,225.
- There is a lack of healthy support levels on the downside.

BTC/USD daily confluence detector
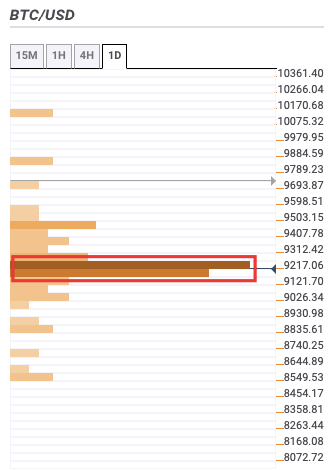
BTC/USD bulls took back control in the early hours of Tuesday as the price went up from $9,162.22 to $9,170.15. This followed a bearish Monday wherein the price fell below the $9,200 level. The daily confluence detector shows a lack of healthy support on the downside. The bulls, however, face a strong resistance stack between $9,200 – $9,225.
This stack of resistance sees the confluence of a variety of technical levels. These levels include the 15-min Previous High, one-hour Previous High, 4-hour Previous High, 15-min Previous Low, one-hour Previous Low, one-day Previous Low, one-month Fibonacci 23.6% retracement level, one-day Fibonacci 38.2% retracement level, 15-min Bollinger Band upper curve, one-hour Bollinger Band middle curve, one-hour Bollinger Band upper curve, 4-hour Bollinger Band upper curve, one-day Bollinger Band middle curve, 15-min Bollinger Band middle curve, 4-hour Bollinger Band middle curve, 15-min SMA 5, one-hour SMA 5, 4-hour SMA 5, one-day SMA 5, 15-min SMA 10, one-hour SMA 10, 4-hour SMA 10, one-day SMA 10, one-hour SMA 50, 4-hour SMA 50, 15-min SMA 100, 4-hour SMA 100 and 15-min SMA 200.
Author

Rajarshi Mitra
Independent Analyst
Rajarshi entered the blockchain space in 2016. He is a blockchain researcher who has worked for Blockgeeks and has done research work for several ICOs. He gets regularly invited to give talks on the blockchain technology and cryptocurrencies.


