Bitcoin price today:$66,800
- US Bitcoin Spot ETFs recorded a second straight day of inflows on Tuesday.
- Arkham Intelligence data shows that Tesla has recently moved $760 million worth of Bitcoin into other wallets.
- Glassnode’s report highlights declining demand and supply for Bitcoin, predicting an increase in volatility ahead.
Bitcoin’s (BTC) price stabilizes around $67,000 on Wednesday after rallying and breaking above a key resistance barrier on Tuesday. The rise in BTC comes after US Spot ETFs recorded a second straight day of inflows of over $373 million on Tuesday. However, some concerns were raised due to the recent transfer of funds by Tesla, while a report from Glassnode highlights that BTC is expected to experience volatility in the short term.
Bitcoin Insitutional demand shows strength despite Tesla funds movement in BTC
Institutional demand for Bitcoin shows signs of strength. According to Coinglass data, US Bitcoin Spot ETFs recorded a second straight day of inflows of $373.30 million on Tuesday. Studying the ETF flow data can be useful for observing institutional investors’ sentiment. If the magnitude of inflows persists or increases, it would signal a rise in demand for Bitcoin, further contributing to its price rally.

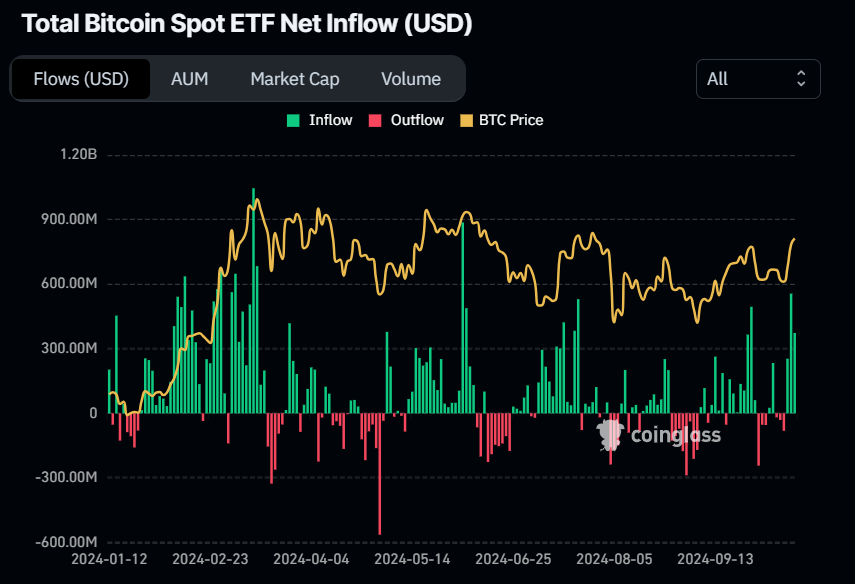
Bitcoin Spot ETF Net Inflow chart. Source: Coinglass
Despite the rising institutional demand, Arkham Intelligence data shows that Tesla has moved $760 million worth of Bitcoin into other wallets since Tuesday. This transfer of funds is still unclear if it’s internal shuffling or selling.
TESLA JUST MOVED ANOTHER $260M BTC
— Arkham (@ArkhamIntel) October 15, 2024
TOTAL MOVED: $760M pic.twitter.com/ukAcHW1EZC
“Even if they sold, the impact would be slightly more than half of the German government’s. Their realized profit was $816 million, while Tesla’s is $515 million as of today,” said Ki Young Ju, founder and CEO of CryptoQuant, in a Twitter post.
A Glassnode report on Tuesday highlights a notable divergence between supply and demand for Bitcoin, which has traded range-bound for over seven months. With low volumes across on-chain and futures markets and a HODLer-dominated environment, the scene is set for heightened volatility in the near future, the report says.
For the demand side, Glassnode analysts explain that the rate of new capital inflow has continued to wane since the $73,000 all-time high set in March. Measuring the Realized Profit or Realized Loss metrics can act as proxies for the magnitude of new capital entering or exiting the network.
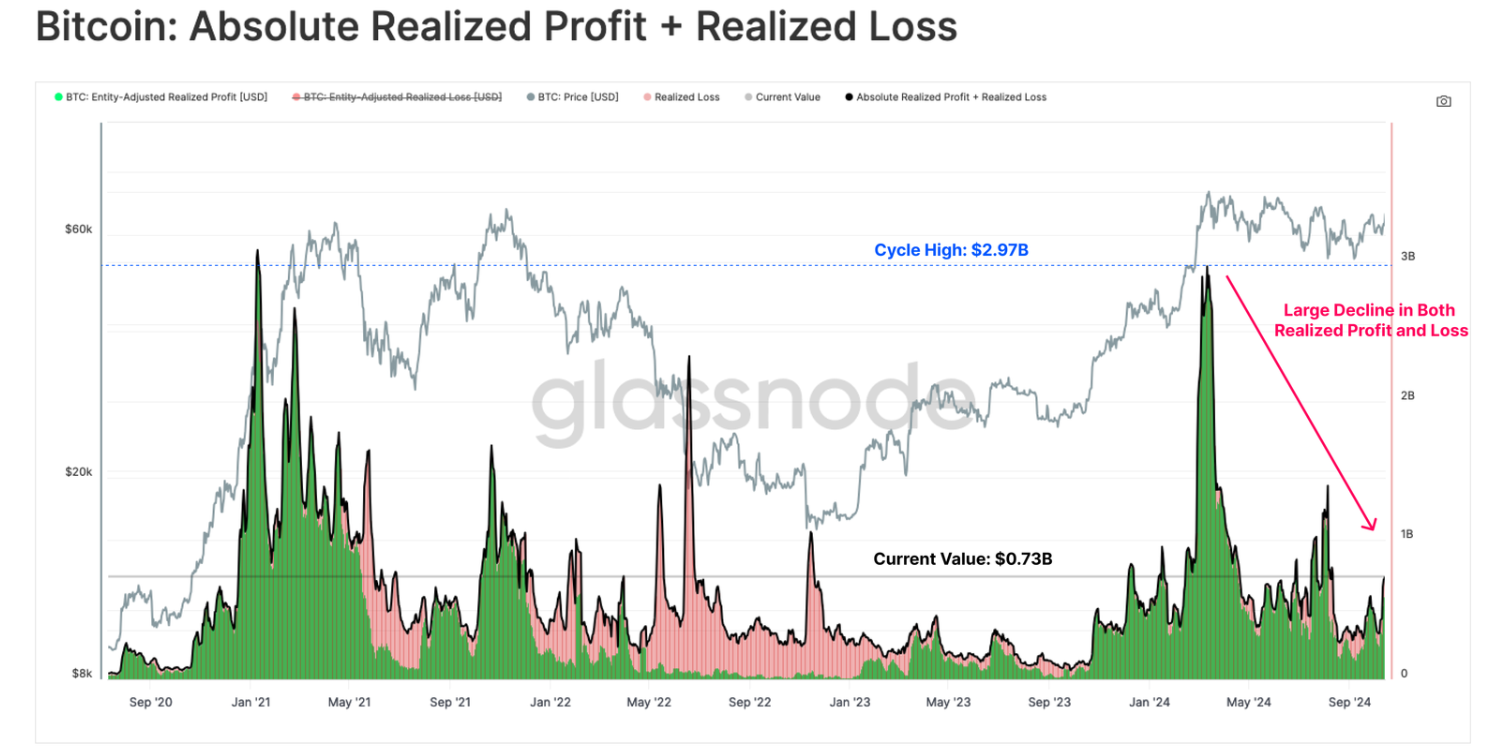
Bitcoin Absolute Realized Profit+Realized Loss chart. Source: Glassnode
Moreover, the Binary CDD metric clearly assesses the demand side. This metric tracks the expenditure of “holding time” in the market, tracking when holders of old supply transact large volumes.
The graph below shows a relatively light volume of coinday destruction, suggesting that long-term investors remain relatively inactive within the current price range. This signals investor attention, and new demand inflows within this range are relatively muted.
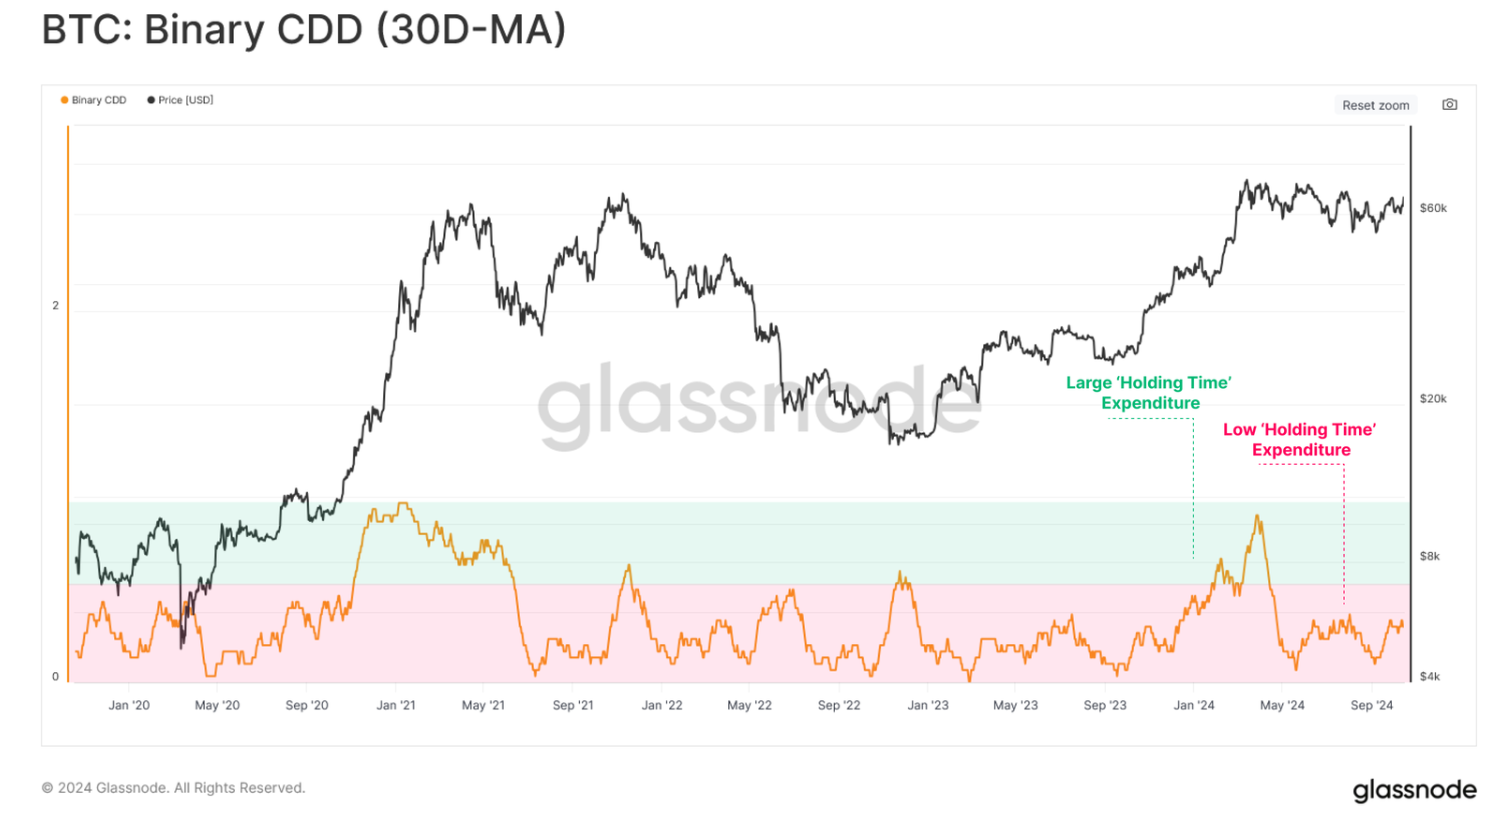
Bitcoin Binary CDD chart. Source: Glassnode
The report explains that available coins are also constricting on the supply side, with several measures of “active supply” compressing to relatively low levels. As shown in the graph below, acute tightness across the Bitcoin supply side has been a precursor for a regime of heightened volatility.
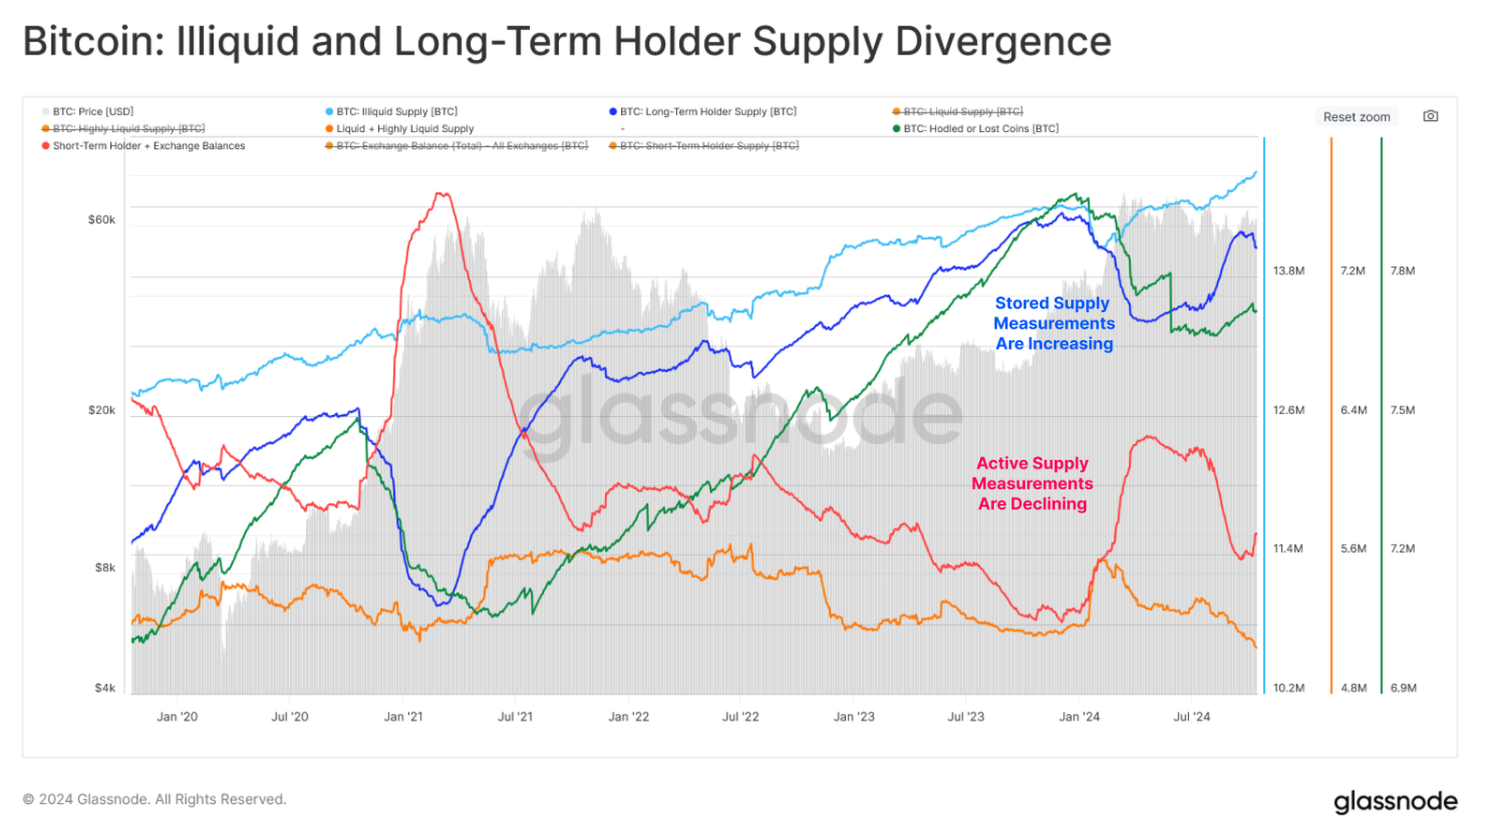
Bitcoin Illiguid and Long-Term Holders Supply chart. Source: Glassnode
The confidence of new investors in the market trend has also remained within the neutral range, highlighting that spending by new buyers is not drastically different from the price of the original acquisition.
Despite the slightly negative sentiment caused by the recent tumultuous market conditions, the confidence level among new investors is notably higher than in both the 2019-2020 and 2021 markets.
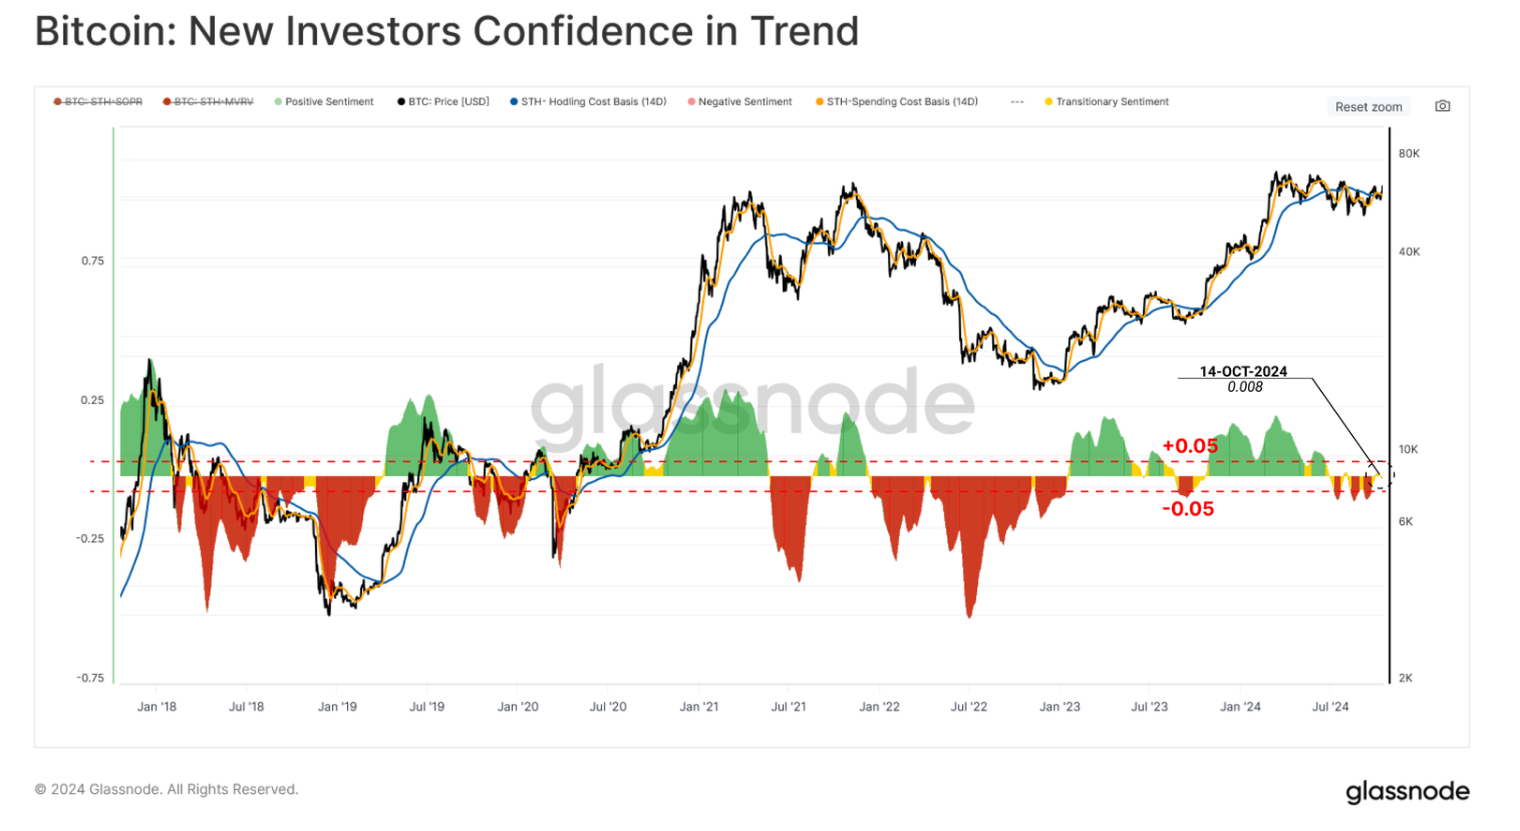
Bitcoin New Investors Confidence in Trend chart. Source: Glassnode
Bitcoin Price Forecast: BTC closes above $66,000 resistance
Bitcoin price broke and closed above the psychological level of $66,000 on Tuesday, rising 1.5%. As of Wednesday, it trades slightly down around $67,000.
If the $66,000 holds as support, BTC could continue its ongoing rally to retest its July 29 high of $70,079.
The Moving Average Convergence Divergence (MACD) indicator further supports Bitcoin’s rise after posting on Monday a bullish crossover on the daily chart. The MACD line (blue line) moved above the signal line (yellow line), giving a buy signal. It also shows rising green histogram bars above the neutral line of zero, suggesting increasing upward momentum.
Furthermore, the daily chart’s Relative Strength Index (RSI) shows that Bitcoin is nearing its overbought level. It trades at 65, close to the overbought level of 70. If it enters the zone on a closing basis, traders will be advised not to add to their long positions because the chances of a pullback would increase. Another possibility, however, is that the rally continues and the RSI stays in the overbought zone. If it enters overbought and then exits back into the neutral level of 50, it will be a sign of a deeper correction.
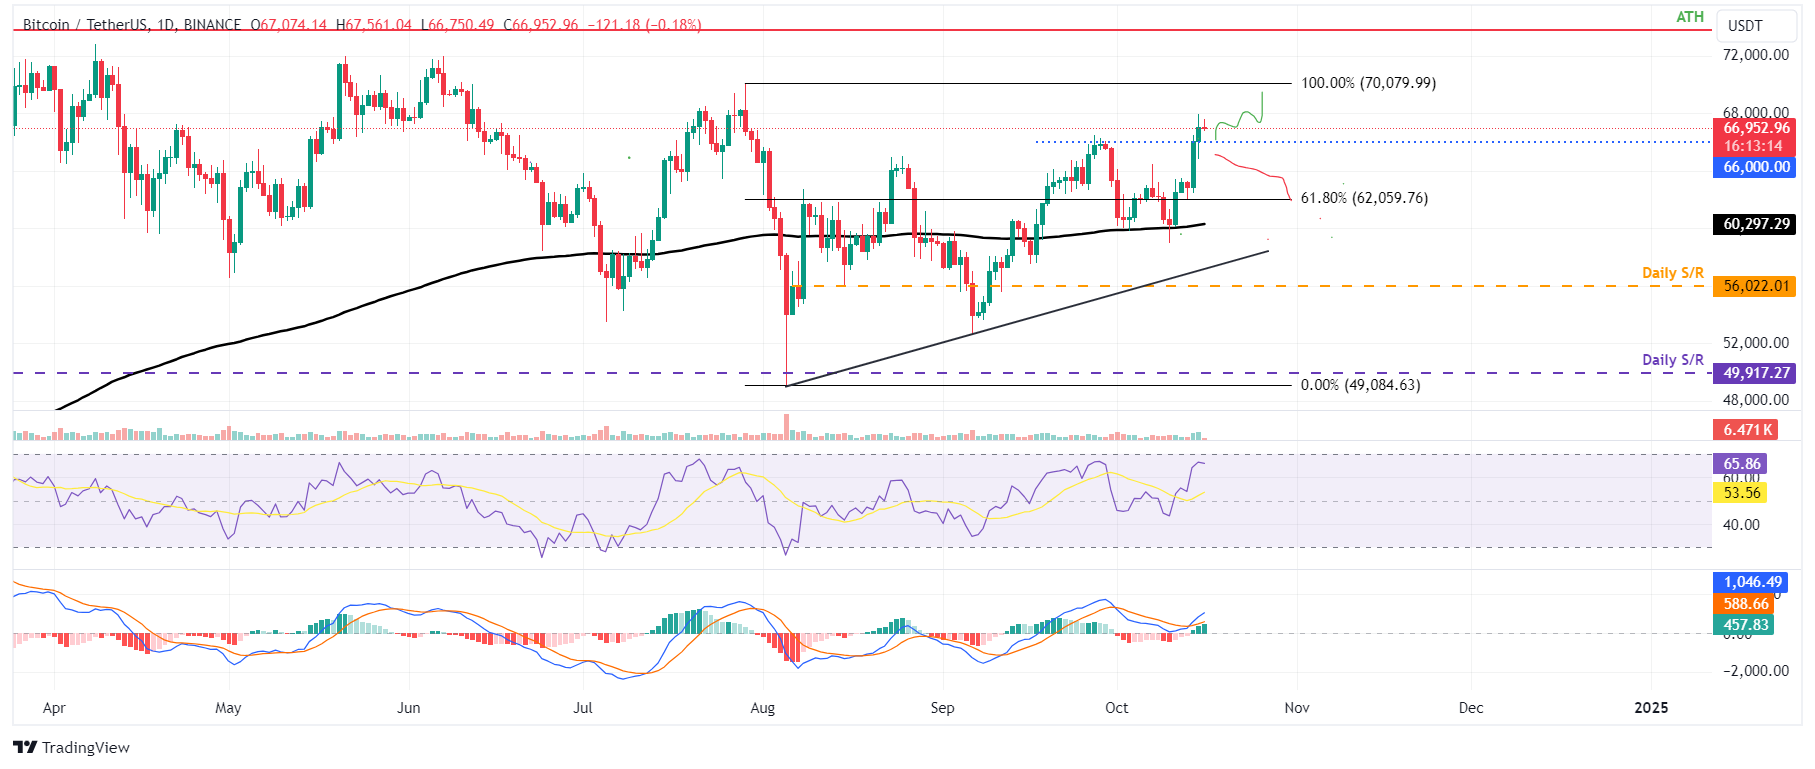
BTC/USDT daily chart
However, if Bitcoin fails to find support around the $66,000 level and closes below it, BTC could extend the decline by 6% and retest its $62,000 support level, which aligns with the 61.8% Fibonacci retracement level at $62,059 (drawn from July high of $70,079 to August low of $49,084).
Bitcoin, altcoins, stablecoins FAQs
Bitcoin is the largest cryptocurrency by market capitalization, a virtual currency designed to serve as money. This form of payment cannot be controlled by any one person, group, or entity, which eliminates the need for third-party participation during financial transactions.
Altcoins are any cryptocurrency apart from Bitcoin, but some also regard Ethereum as a non-altcoin because it is from these two cryptocurrencies that forking happens. If this is true, then Litecoin is the first altcoin, forked from the Bitcoin protocol and, therefore, an “improved” version of it.
Stablecoins are cryptocurrencies designed to have a stable price, with their value backed by a reserve of the asset it represents. To achieve this, the value of any one stablecoin is pegged to a commodity or financial instrument, such as the US Dollar (USD), with its supply regulated by an algorithm or demand. The main goal of stablecoins is to provide an on/off-ramp for investors willing to trade and invest in cryptocurrencies. Stablecoins also allow investors to store value since cryptocurrencies, in general, are subject to volatility.
Bitcoin dominance is the ratio of Bitcoin's market capitalization to the total market capitalization of all cryptocurrencies combined. It provides a clear picture of Bitcoin’s interest among investors. A high BTC dominance typically happens before and during a bull run, in which investors resort to investing in relatively stable and high market capitalization cryptocurrency like Bitcoin. A drop in BTC dominance usually means that investors are moving their capital and/or profits to altcoins in a quest for higher returns, which usually triggers an explosion of altcoin rallies.
Information on these pages contains forward-looking statements that involve risks and uncertainties. Markets and instruments profiled on this page are for informational purposes only and should not in any way come across as a recommendation to buy or sell in these assets. You should do your own thorough research before making any investment decisions. FXStreet does not in any way guarantee that this information is free from mistakes, errors, or material misstatements. It also does not guarantee that this information is of a timely nature. Investing in Open Markets involves a great deal of risk, including the loss of all or a portion of your investment, as well as emotional distress. All risks, losses and costs associated with investing, including total loss of principal, are your responsibility. The views and opinions expressed in this article are those of the authors and do not necessarily reflect the official policy or position of FXStreet nor its advertisers. The author will not be held responsible for information that is found at the end of links posted on this page.
If not otherwise explicitly mentioned in the body of the article, at the time of writing, the author has no position in any stock mentioned in this article and no business relationship with any company mentioned. The author has not received compensation for writing this article, other than from FXStreet.
FXStreet and the author do not provide personalized recommendations. The author makes no representations as to the accuracy, completeness, or suitability of this information. FXStreet and the author will not be liable for any errors, omissions or any losses, injuries or damages arising from this information and its display or use. Errors and omissions excepted.
The author and FXStreet are not registered investment advisors and nothing in this article is intended to be investment advice.
Recommended Content
Editors’ Picks

Michael Saylor predicts Bitcoin to surge to $100K by year-end
MicroStrategy's executive chairman, Michael Saylor, predicts Bitcoin will hit $100,000 by the end of 2024, calling the United States (US) election outcome the most significant event for Bitcoin in the last four years.

Ripple surges to new 2024 high on XRP Robinhood listing, Gensler departure talk
Ripple price rallies almost 6% on Friday, extending the 12% increase seen on Thursday, following Robinhood’s listing of XRP on its exchange. XRP reacts positively to recent speculation about Chair Gary Gensler leaving the US Securities and Exchange Commission.

Bitcoin Weekly Forecast: New high of $100K or correction to $78K?
Bitcoin surged to a new all-time high of $93,265 in the first half of the week, followed by a slight decline in the latter half. Reports highlight that Bitcoin’s current level is still not overvalued and could target levels above $100,000 in the coming weeks.

Top 3 Price Prediction Bitcoin, Ethereum, Ripple: BTC to 100k or pullback to 78k?
Bitcoin and Ethereum showed a modest recovery on Friday following Thursday's downturn, yet momentum indicators suggest continuing the decline as signs of bull exhaustion emerge. Ripple is approaching a key resistance level, with a potential rejection likely leading to a decline ahead.

Bitcoin: Further upside likely after hitting new all-time high
Bitcoin hit a fresh high of $76,849 on Thursday as crypto-friendly candidate Donald Trump won the US presidential election. Institutional demand returned with the highest single-day inflow on Thursday since the ETFs’ launch in January.

Best Forex Brokers with Low Spreads
VERIFIED Low spreads are crucial for reducing trading costs. Explore top Forex brokers offering competitive spreads and high leverage. Compare options for EUR/USD, GBP/USD, USD/JPY, and Gold.