Bitcoin (BTC) dipped below $50,000 again on Thursday as the fallout from Elon Musk’s criticism continued to resonate.

Bitcoin

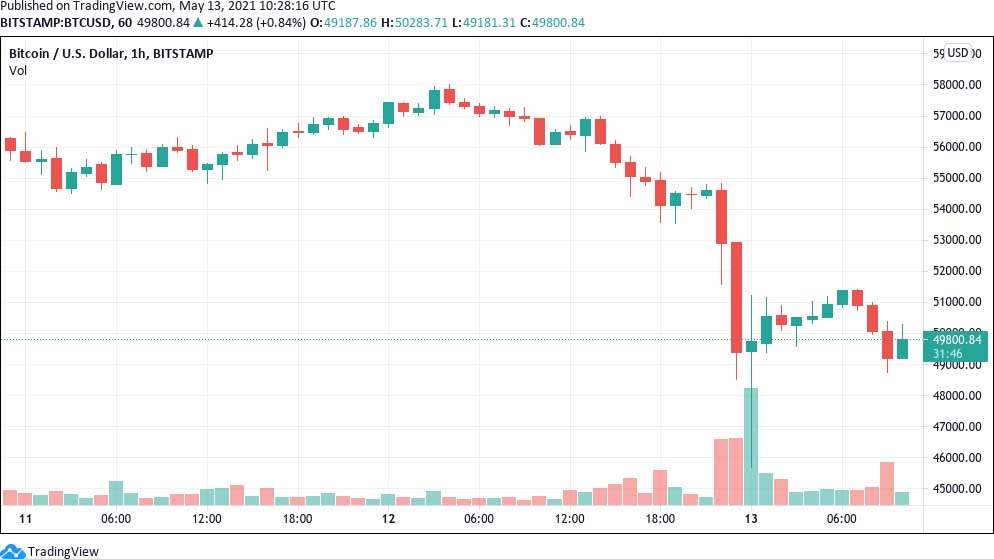
BTC/USD 1-hour candle chart (Bitstamp). Source: TradingView

Traders wait for telltale buy signals

Data from Cointelegraph Markets Pro and TradingView confirmed BTC/USD failing to establish $50,000 as support after initially dipping to $45,650.

Musk, speaking as CEO of Tesla, had claimed that environmental concerns meant that the company would no longer accept BTC payments. 

After a three-hour slow crash, BTC/USD then rebounded to near $52,000 before losing steam once more. At the time of writing, the pair traded at around $49,500 amid heavy volatility

As Cointelegraph reported earlier, however, Bitcoin price trends beyond the short term remained unchanged by Musk and traders’ responses to him. 

For popular trader Scott Melker, it was thus time to use an established method for determining when the price floor was likely to hit.

For this, he used the relative strength index (RSI), a classic indicator of overbought or oversold areas.

“I post this every time 4 hour RSI goes oversold and it works more times than not. An overbought bear div was the top,” he told Twitter followers.

“Now I want to see a lower low in price and a higher low on RSI. Could be this candle or take days, but it’s the signal I want.”

Thursday had already seen Bitcoin cancel its downtrend when it encountered the 21-week exponential moving average (21EMA). This line in the sand had held throughout the past year’s bull market and that of 2017 and is thought to provide reliable support for periods where bullish momentum sees a short-term retracement.

The 21EMA was still rising steeply this month, demanding that BTC/USD thus returns to setting higher highs and higher lows on weekly timeframes in order to preserve its usefulness.

Previously, a warning had given $40,000 as a potential low should $50,000 fail to hold.

Bitcoin bears battle essential moving average

Meanwhile, as investors rushed to “buy the dip,” attention turned to where large clusters of bids from whale buyers might also help buoy the price.

Bitcoin had paid no attention to whale positions north of $50,000 despite plenty of buying occurring as high as $58,000. 

For monitoring resource Whalemap, however, the number of coins being transacted at a loss suggested that “panic” was already visible on the market even before the Musk episode.

“These moments have historically been good buying opportunities as they indicate panic on the market,” part of a tweet on Tuesday explained.

Bitcoin

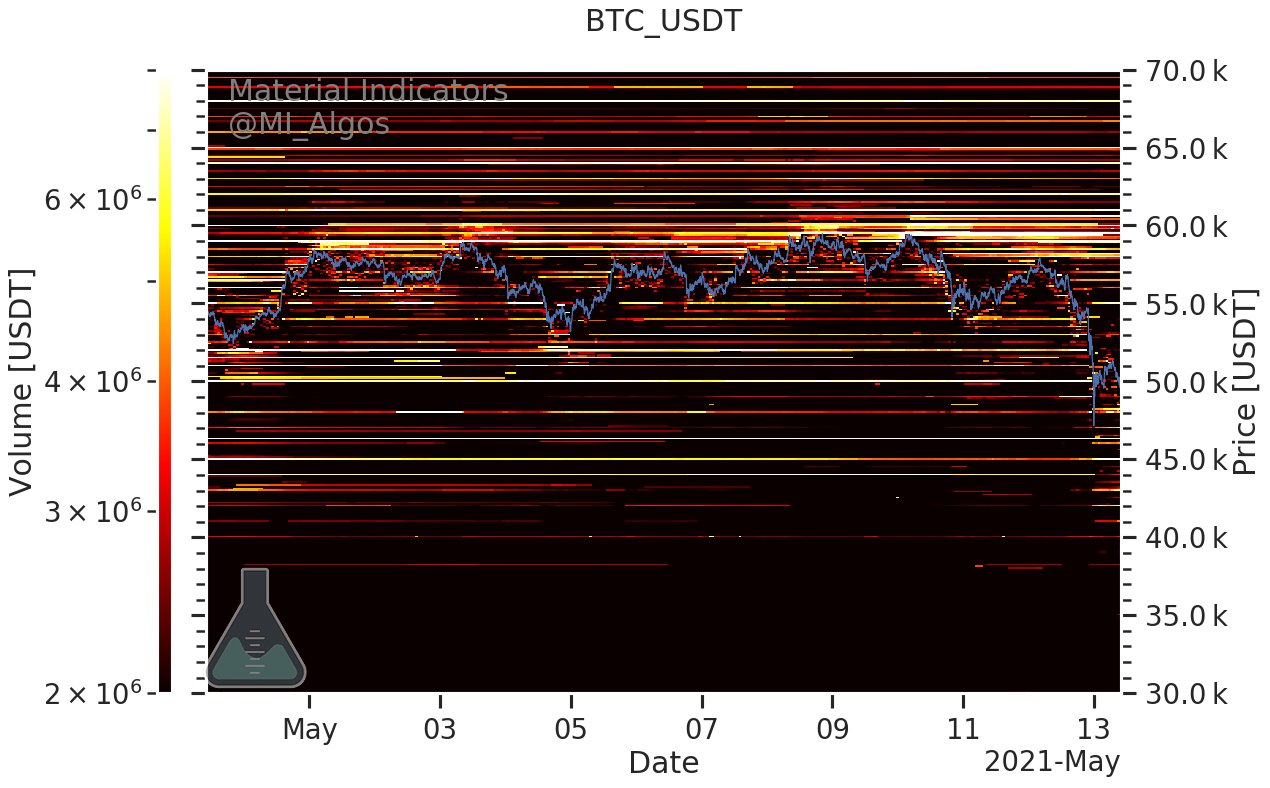
BTC/USD buy and sell position strength (Binance). Source: Material Indicators

A look at buy and sell order configurations on Binance additionally showed retail investors now protecting $45,000, with $55,000 and upward becoming strong resistance.


Information on these pages contains forward-looking statements that involve risks and uncertainties. Markets and instruments profiled on this page are for informational purposes only and should not in any way come across as a recommendation to buy or sell in these assets. You should do your own thorough research before making any investment decisions. FXStreet does not in any way guarantee that this information is free from mistakes, errors, or material misstatements. It also does not guarantee that this information is of a timely nature. Investing in Open Markets involves a great deal of risk, including the loss of all or a portion of your investment, as well as emotional distress. All risks, losses and costs associated with investing, including total loss of principal, are your responsibility. The views and opinions expressed in this article are those of the authors and do not necessarily reflect the official policy or position of FXStreet nor its advertisers.

Join Telegram

Recommended content


Recommended Content

Editors’ Picks

Celebrity meme coins controversy continues amid Pump.fun revenue dominance

Celebrity meme coins controversy continues amid Pump.fun revenue dominance

Pump.fun outperformed the Ethereum blockchain on Tuesday after raking in $1.99 million. Following this achievement, a meme coin based on actress Sydney Sweeney was the subject of controversy after its developers dumped their bags on investors.

More Meme Coins News

PEPE's on-chain metrics indicate potential rally after weeks of silence

PEPE's on-chain metrics indicate potential rally after weeks of silence

PEPE has struggled to see any significant price move after reaching an all-time high in May. Increased adoption rate and low MVRV ratio indicate a bullish run may be on the horizon. A single PEPE outflow from Binance worth $14.7 million gives credence to signs of bullish expectation.

More Pepe News

Ethereum has failed to overcome key resistance despite bullish sentiment surrounding ETH ETF

Ethereum has failed to overcome key resistance despite bullish sentiment surrounding ETH ETF

Ethereum (ETH) is down more than 1.4% on Tuesday following another ETH sale from the Ethereum Foundation. Meanwhile, crypto exchange Gemini's recent report reveals that ETH ETF could see about $5 billion in net inflows within six months of launch.

More Ethereum News

Crypto community blasts Polkadot following report of treasury spending

Crypto community blasts Polkadot following report of treasury spending

Polkadot reports $87 million of treasury spending during H1. Crypto community members expressed harsh feelings toward the DOT team's high spending. DOT is up more than 2% in the past 24 hours but risks correction following the report.

More Polkadot News

Bitcoin: BTC price correction could end in July, according to seasonal data

Bitcoin: BTC price correction could end in July, according to seasonal data

Bitcoin (BTC) price appears poised for a decline this week, influenced by slight outflows in US spot ETFs, selling activity among BTC miners, and a combined transfer of 4,690.28 BTC to centralized exchanges by the US and German governments.

Read full analysis

BTC

ETH

XRP