Bitcoin price falls amidst German government transfers
- US spot Bitcoin ETFs registered slight outflows on Wednesday.
- The German Government transferred another 3,000 BTC, valued at $174 million, on Thursday.
- On-chain data shows positive exchange netflow, and the Taker Buy Sell Ratio declines.
- Network Realized Profit/Loss (NPL) data shows an uptick on Wednesday.

Bitcoin (BTC) faced rejection at the daily resistance level of $63,956 on Monday, resulting in a 4.2% decline over the next two days. BTC’s price extends its downward move and falls below $58,000 on Thursday, adding more than 4% losses in the day.
On-chain data indicates whales are taking profits, exchange supplies are increasing, US spot Bitcoin ETFs see outflows, and the Taker Buy Sell Ratio is below one, coinciding with the German Government transferring an additional 3,000 BTC, valued at $172 million, on the same day. This indicates market weakness that may contribute to further price declines in BTC.
Daily digest market movers: Bitcoin price declines as German government transfers weigh
- According to data from Lookonchain, the German Government transferred 3,000 BTC, valued at $174 million, from its wallet on Thursday. Of this, 1,300 BTC, worth $75.5 million, were transferred to Coinbase, Bitstamp and Kraken exchanges.
- Over the past week, German authorities have moved 2,240 BTC worth $142 million to Coinbase, Bitstamp, Flow Traders, and Kraken. This significant transfer activity may have fueled FUD (Fear, Uncertainty, Doubt) among traders, potentially influencing Bitcoin's more than 4% price decline on Thursday.
The German Government transferred 3,000 $BTC($174M) out again, of which 1,300 $BTC($75.5M) was transferred to #Bitstamp, #Coinbase and #Kraken.
— Lookonchain (@lookonchain) July 4, 2024
German Government currently holds 40,359 $BTC($2.33B).https://t.co/x0aJljKn2C pic.twitter.com/Bk6oDEmGOa
- On Wednesday, US spot Bitcoin ETFs saw outflows of $20.50 million after $13.70 million on Tuesday. During this period, Grayscale (GBTC) reduced its holdings by 434.62 BTC, while Fidelity's Bitcoin ETF (FBTC) increased its holdings by 104.63 BTC.
- These two consecutive days of decline hint at a mild waning of investor confidence, potentially signaling a temporary dip in Bitcoin's price. The net inflow data from ETFs is crucial for gauging investor sentiment and understanding market dynamics. Combined, the 11 US spot Bitcoin ETFs currently hold reserves totaling $53.70 billion in Bitcoin.


Bitcoin Spot ETF Net Inflow chart
- According to data from Lookonchain, a whale has again deposited 1,800 BTC worth $106 million to Binance at a loss.
- Since June 27, this whale has deposited 5,281 BTC, worth $323.2 million, to Binance, resulting in a loss of $20 million.
The whale deposited 1,800 $BTC($106M) to #Binance at a loss again 40 minutes ago.
— Lookonchain (@lookonchain) July 4, 2024
He has deposited 5,281 $BTC($323.2M) to #Binance since June 27, with a loss of ~$20M!https://t.co/VWgcfiOpxU pic.twitter.com/WESV8GkfHV
- According to CryptoQuant data, Bitcoin Exchange netflow is the difference between BTC flowing into and out of the exchange (Inflow—outflow = netflow).
- In BTC's case, a positive netflow was recorded on Wednesday; this trend has generally been positive over the past week. This indicates an increased supply of Bitcoin on exchanges and could suggest that traders prepare to sell or trade their Bitcoin, potentially indicating a bearish sentiment as they anticipate lower prices or seek to realize profits.
%2520-%2520All%2520Exchanges-638556851852308566.png&w=1536&q=95)
Bitcoin Exchange netflow chart
- On-chain data provider Santiment's Network Realized Profit/Loss (NPL) indicator computes a daily network-level Return On Investment (ROI) based on the coin's on-chain transaction volume. Simply put, it is used to measure market pain. Strong spikes in a coin's NPL indicate that its holders are, on average, selling their bags at a significant profit. On the other hand, strong dips imply that the coin's holders are, on average, realizing losses, suggesting panic sell-offs and investor capitulation.
- In BTC's case, the NPL indicator rose from 162.58 million to 673.04 million on Wednesday, coinciding with a 3% price decline. This positive uptick indicates that the holders are, on average, selling their bags at a significant profit.
- During this event, BTC's supply on exchanges rose from 936,310 to 938,640 on the same day, and this trend has been rising since late June. This increase in supply indicates that investors are moving BTC to exchanges and increasing selling activity.
%2520%5B11.41.50%2C%252004%2520Jul%2C%25202024%5D-638556852432611956.png&w=1536&q=95)
Bitcoin Network Realized Profit/Loss and Supply on Exchanges chart
- Additionally, the Taker Buy Sell Ratio metric measures the ratio of buy volume to sell volume among takers in perpetual swap trades. Ratios above 1 signify prevailing bullish sentiment, whereas ratios below 1 indicate prevailing bearish sentiment.
- In BTC's case, the Taker Buy-Sell Ratio stands at 0.82, indicating bearish sentiment as traders anticipate a potential asset price decline. This sentiment coincided with Bitcoin's 3% price decline on Wednesday.
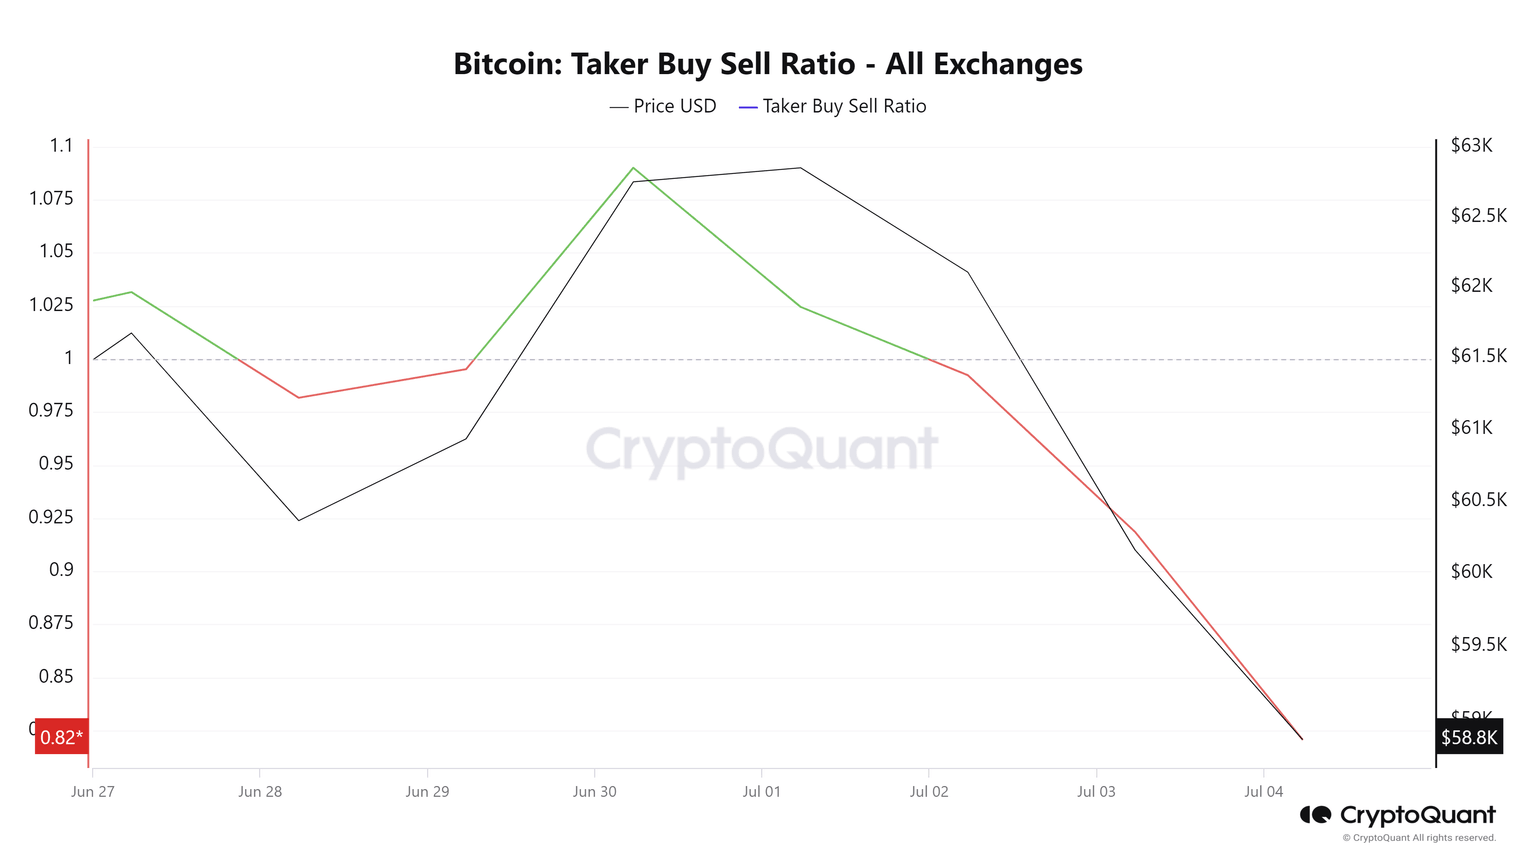
Bitcoin Taker Buy Sell Ratio chart
Technical analysis: BTC retests its support level around $58,000
Bitcoin's price was rejected by the daily resistance level at $63,956 on Monday and declined 4.2% in two days. At the time of writing, it continues trading down by more than 4% at around $58,000 on Thursday.
If BTC's price closes below the weekly support level at $58,375, it could decline 3% to revisit its May 1 low of $56,522.
The Relative Strength Index (RSI) and the Awesome Oscillator (AO) on the daily chart support this bearish thesis, as both indicators are below their respective neutral levels of 50 and zero. This suggests continued momentum favoring bears, potentially leading to a further decline in the Bitcoin price.
If the bears are aggressive and the overall crypto market outlook is negative, BTC could extend an additional decline of 8% to revisit its daily support at $52,266.

BTC/USDT daily chart
However, if BTC closes above the $63,956 daily resistance level and forms a higher high in the daily time frame, it could indicate that bullish sentiment persists. Such a development may trigger a 5% rise in Bitcoin's price to revisit its next weekly resistance at $67,147.
Bitcoin, altcoins, stablecoins FAQs
Bitcoin is the largest cryptocurrency by market capitalization, a virtual currency designed to serve as money. This form of payment cannot be controlled by any one person, group, or entity, which eliminates the need for third-party participation during financial transactions.
Altcoins are any cryptocurrency apart from Bitcoin, but some also regard Ethereum as a non-altcoin because it is from these two cryptocurrencies that forking happens. If this is true, then Litecoin is the first altcoin, forked from the Bitcoin protocol and, therefore, an “improved” version of it.
Stablecoins are cryptocurrencies designed to have a stable price, with their value backed by a reserve of the asset it represents. To achieve this, the value of any one stablecoin is pegged to a commodity or financial instrument, such as the US Dollar (USD), with its supply regulated by an algorithm or demand. The main goal of stablecoins is to provide an on/off-ramp for investors willing to trade and invest in cryptocurrencies. Stablecoins also allow investors to store value since cryptocurrencies, in general, are subject to volatility.
Bitcoin dominance is the ratio of Bitcoin's market capitalization to the total market capitalization of all cryptocurrencies combined. It provides a clear picture of Bitcoin’s interest among investors. A high BTC dominance typically happens before and during a bull run, in which investors resort to investing in relatively stable and high market capitalization cryptocurrency like Bitcoin. A drop in BTC dominance usually means that investors are moving their capital and/or profits to altcoins in a quest for higher returns, which usually triggers an explosion of altcoin rallies.
Author

Manish Chhetri
FXStreet
Manish Chhetri is a crypto specialist with over four years of experience in the cryptocurrency industry.


