• Bitcoin price reaffirms a triangle breakout to $28,000 after surpassing $24,000.
  • Whales holding 1,000 and more coins grow to 2,051 from 2,040 in a week.
  • Bitcoin price is required to make a daily close above $24,000 to reinforce the move to $28,000.

Bitcoin price kicked off the new week on a positive note, climbing 4.50% to trade at $24,086 at the time of writing. The larger cryptocurrency market appears to have flipped green, led by Avalanche’s 11.30% gains, Polkadot’s 9.20%, Solana’s 7.30% and Ethereum’s 6.50%. As for Bitcoin price, fundamentals are growing stronger by the day, thus becoming the main bear market rally drivers.

Bitcoin Whales Return With A Bang

There are 2,051 addresses holding 1,000 and above BTC. This number has increased by 0.54% from 2,040 addresses on August 2. A whale is any Bitcoin address containing not less than 1,000 BTC. The actual owners of these wallets remain largely unknown due to the pseudonymous nature of the blockchain network.

bitcoin

Bitcoin Supply Distribution

Bitcoin price tends to increase in value when whales buy in droves; the opposite also holds water. As observed in the chart above, Bitcoin price has been unable to sustain any bullish reversal attempts from the beginning of the year because whales increasingly sold, adding to the selling pressure.

Bitcoin price settled above $24,000 as part of the plan to close the gap to $28,000 if large volume investors keep their buying activities intact.

A closer glance at the technical outlook for Bitcoin price shows the possibility of a bullish daily candle forming, which will go a long way to affirm the buyers’ newly reclaimed control. After testing the ascending triangle’s hypotenuse, Bitcoin price retriggered the potential for a 22.36% breakout to $28,000.

Including the step above $24,000,  the flagship cryptocurrency is already quite close to hitting the upside target. Bitcoin price will only need to move another 15% to brush shoulders with $28,000.
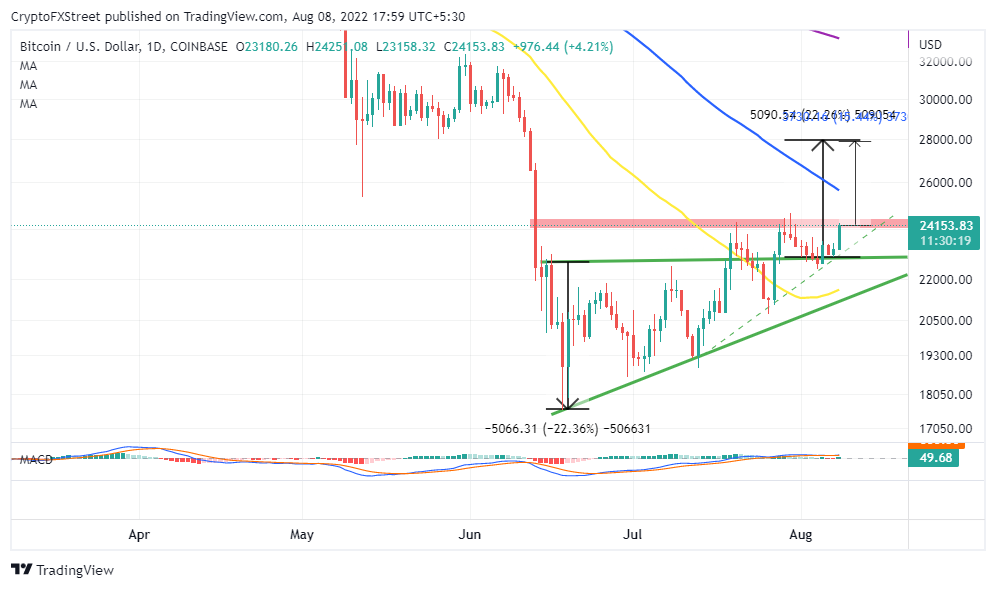
Bitcoin price

BTC/USD Daily Chart

Similarly, the Moving Average Convergence Divergence (MACD) position on the daily chart further tips the scale in the bulls’ favor. As long as the MACD keeps moving higher above the mean line, the path with the least resistance will be to the upside. Traders should keenly follow the overlap of the 12-day Exponential Moving Average (EMA) and the 26-day EMA to quickly and accurately time price reversal.


Information on these pages contains forward-looking statements that involve risks and uncertainties. Markets and instruments profiled on this page are for informational purposes only and should not in any way come across as a recommendation to buy or sell in these assets. You should do your own thorough research before making any investment decisions. FXStreet does not in any way guarantee that this information is free from mistakes, errors, or material misstatements. It also does not guarantee that this information is of a timely nature. Investing in Open Markets involves a great deal of risk, including the loss of all or a portion of your investment, as well as emotional distress. All risks, losses and costs associated with investing, including total loss of principal, are your responsibility. The views and opinions expressed in this article are those of the authors and do not necessarily reflect the official policy or position of FXStreet nor its advertisers. The author will not be held responsible for information that is found at the end of links posted on this page.

If not otherwise explicitly mentioned in the body of the article, at the time of writing, the author has no position in any stock mentioned in this article and no business relationship with any company mentioned. The author has not received compensation for writing this article, other than from FXStreet.

FXStreet and the author do not provide personalized recommendations. The author makes no representations as to the accuracy, completeness, or suitability of this information. FXStreet and the author will not be liable for any errors, omissions or any losses, injuries or damages arising from this information and its display or use. Errors and omissions excepted.

The author and FXStreet are not registered investment advisors and nothing in this article is intended to be investment advice.

Join Telegram

Recommended content


Recommended Content

Editors’ Picks

Here are the best and worst-performing cryptocurrencies in H1 2024

Here are the best and worst-performing cryptocurrencies in H1 2024

A recent report by Crypto Koryo on Wednesday revealed meme coins as the top performers among cryptocurrencies so far in 2024, with several altcoins coming in behind. The worst-performing tokens are DeFi and governance tokens.

More Cryptocurrencies News

Ethereum poised to follow Nvidia's steps as Bitwise files updated S-1 draft

Ethereum poised to follow Nvidia's steps as Bitwise files updated S-1 draft

Ethereum (ETH) is down 3% on Wednesday following Bitwise filing an updated S-1 draft and a wider market downturn with potential Mt. Gox BTC supply flooding the market. 

More Ethereum News

What to expect from altcoins as ETH ETF approval draws closer

What to expect from altcoins as ETH ETF approval draws closer

As the crypto market continues consolidating on Wednesday, altcoins show mixed signals ahead of the spot ETH ETF launch. Many have predicted that the alt season may not occur in this cycle following the market lull. However, two key metrics suggest otherwise.

More Cryptocurrencies News

PolitiFi meme coins surge as Biden support lowers

PolitiFi meme coins surge as Biden support lowers

Crypto prediction markets favor Kamala Harris over President Joe Biden as Democratic nominee in upcoming presidential elections. Meme coins based on Vice President Harris rallied amid BODEN token's 30% decline. Other tokens based on possible replacements for Biden experienced similar surges.

More Cryptocurrencies News

Bitcoin: BTC price correction could end in July, according to seasonal data

Bitcoin: BTC price correction could end in July, according to seasonal data

Bitcoin (BTC) price appears poised for a decline this week, influenced by slight outflows in US spot ETFs, selling activity among BTC miners, and a combined transfer of 4,690.28 BTC to centralized exchanges by the US and German governments.

Read full analysis

BTC

ETH

XRP