![]() Tanya Abrosimova
Tanya Abrosimova
Independent Analyst
- Bitcoin network activity is not growing along with the price increase.
- Long-term charts show the market is on the verge of a correction.
- BTC may still retest an all-time high before the sell-off starts.
Bitcoin hit a new multi-year high of $18,488 on November 18. After the initial retreat to $17,200, the pioneer digital asset managed to settle above $18,000. However, the upside momentum seems to be fading away now.
While on the long-term time frames, the price continues moving within a clear upside trend, several on-chain metrics and technical indicators signify that a significant downside correction may be underway.
At the time of writing, BTC/USD is hovering around $18,200. The coin has gained nearly 4% on a day-to-day basis and 11% on a weekly basis. Bitcoin's market capitalization increased to $330 billion, while its average daily trading volumes reached $37 billion.
Daily Active Addresses metrics create a massive bearish divergence
As the chart below shows, Bitcoin's daily network activity has been receding even though the price moved upwards. This trend led to a significant divergence between the Daily Active Addresses (DAA) and the price momentum. Moreover, the increasingly long red candles signal that the pressure is building up at least since the beginning of October, and the correction may be really severe once it starts. As the indicator does not tell when the price may reverse to the downside, another leg up can be seen before the sell-off begins.
 [13.05.10, 20 Nov, 2020]-637414658510065024.png)
Daily Active Addresses vs. Price Divergence
If the history is any guide, the price may sump by 30-40% and retest $12,500 before another bullish wave starts and take BTC to new all-time highs. Read a more detailed analysis of the historical Bitcoin movements here.
Bitcoin TD Sequential indicator ready to send sell signals
From the technical point of view, BTC is grossly overbought on the long-term time frames. Both weekly and monthly charts contain a green eight candlestick, which is a precursor of a sell signal, produced by a green nine candlestick.
If the sell signal is confirmed, BTC may start a downside correction in the form of one to four red candlesticks, meaning that December 2020, and potentially January 2021, may become less successful months for Bitcoin bulls.
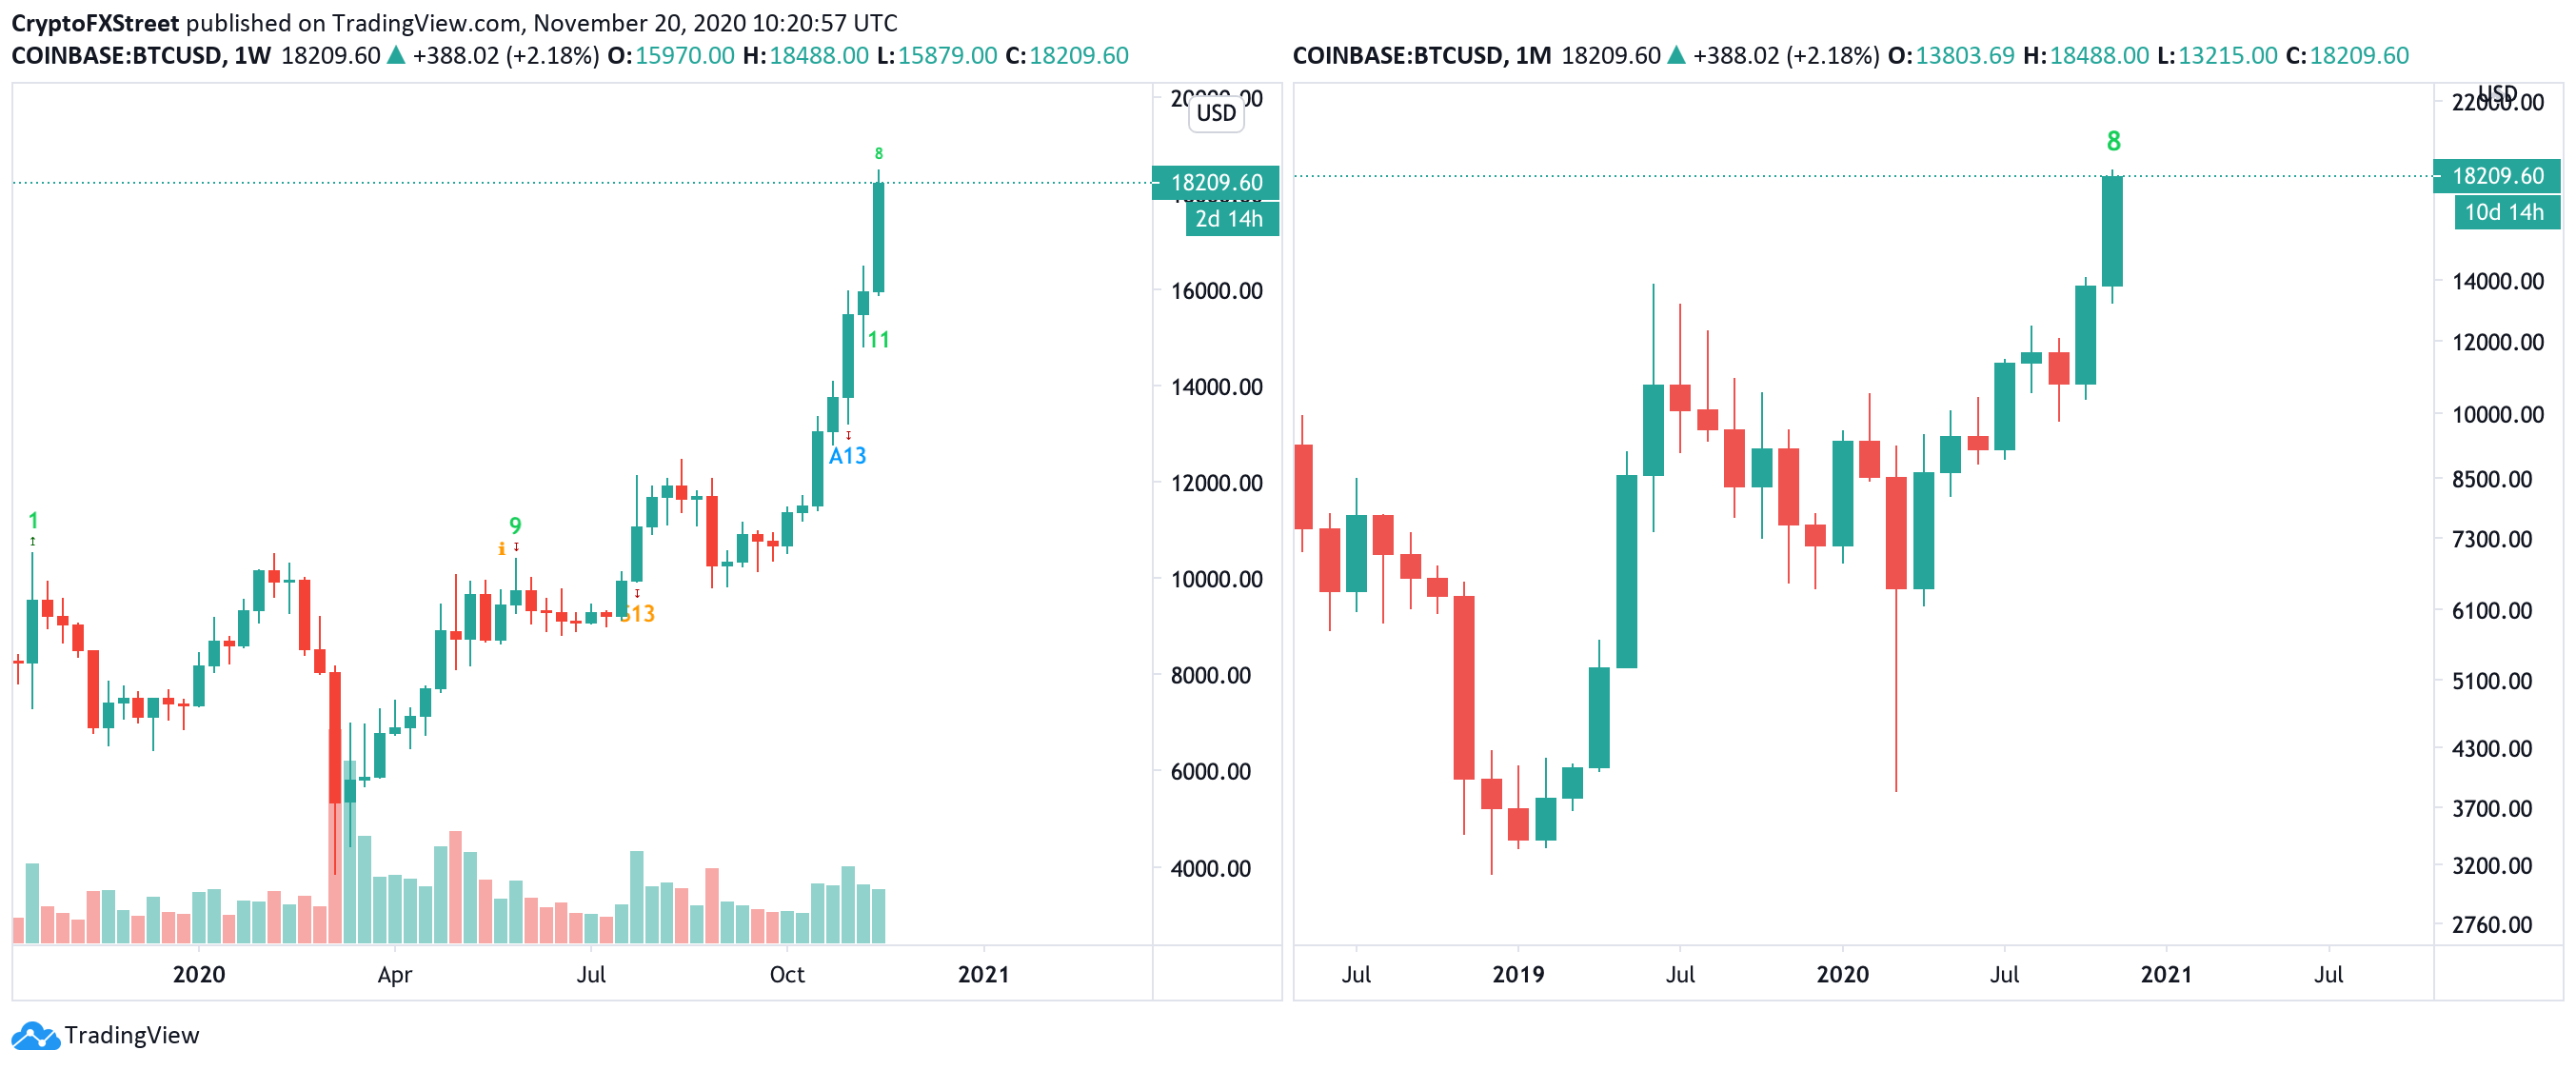
BTC/USD weekly and monthly charts
It's worth noting that a sell signal on the weekly chart will come in two days, while on the monthly one will take 10 days to finish. This means that Bitcoin still has time to retest new highs before the correction starts.
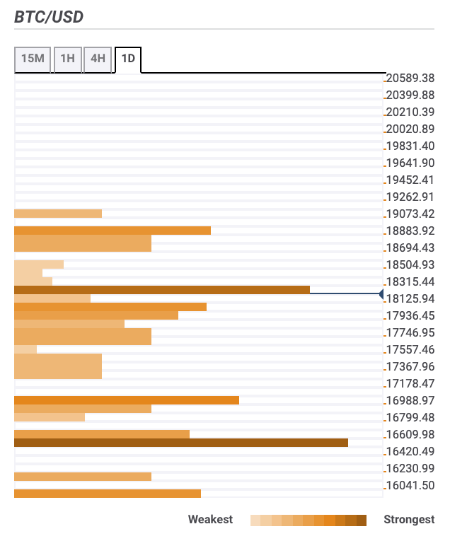
Bitcoin Confluence levels
Bitcoin's daily confluence chart shows several clusters of support levels on the way down. The first local barrier comes on approach to $18,000 with 23.6% Fibonacci retracement level daily. Once it is broken, the sell-off may gain traction with the next focus on $17,000, reinforced by Pivot Point 1-day Support 2 and the Pivot Point 1-week Resistance 1. However, critical support is seen at $16,500. It is created by a previous week high and a Pivot Point 1-month Resistance 2. A sustainable move below this area may become a trigger for a long-term correction.
On the upside, the local barrier is seen on approach to $18,00, the upper line of the daily Bollinger Band and Pivot Point 1-day Resistance 1. Once it is out of the way, the upside is likely to gain traction, with the next focus on the recent high of $18,488.
Note: All information on this page is subject to change. The use of this website constitutes acceptance of our user agreement. Please read our privacy policy and legal disclaimer. Opinions expressed at FXstreet.com are those of the individual authors and do not necessarily represent the opinion of FXstreet.com or its management. Risk Disclosure: Trading foreign exchange on margin carries a high level of risk, and may not be suitable for all investors. The high degree of leverage can work against you as well as for you. Before deciding to invest in foreign exchange you should carefully consider your investment objectives, level of experience, and risk appetite. The possibility exists that you could sustain a loss of some or all of your initial investment and therefore you should not invest money that you cannot afford to lose. You should be aware of all the risks associated with foreign exchange trading, and seek advice from an independent financial advisor if you have any doubts.
Recommended Content
Editors’ Picks

Crypto Today: BNB, OKB, BGB tokens rally as BTC, Shiba Inu and Chainlink lead market rebound
Cryptocurrencies sector rose by 0.13% in early European trading on Friday, adding $352 million in aggregate valuation. With BNB, OKB and BGB attracting demand amid intense market volatility, the exchange-based native tokens sector added $1.9 billion.

US SEC may declare XRP a 'commodity' as Ripple settlement talks begins
The US SEC is considering declaring XRP as a commodity in the ongoing settlement talks with Ripple Labs. FOX News reports suggest Ethereum's regulatory status remains a key reference for XRP’s litigation verdict.

Cardano Price Prediction: ADA could hit $0.50 despite high probability of US Fed rate pause
Cardano price stabilized above $0.70 after posting another 5% decline in its 3rd consecutive losing day. Multiple ADA derivatives trading signals are leaning bullish, but the US trade war impact outweighs the positive shift in inflation indices.
Stablecoin regulatory bill receives green light during Banking Committee hearing
The US Senate Banking Committee voted on Thursday to advance the Guiding and Establishing National Innovation for US Stablecoins (GENIUS) Act, which aims to establish proper regulations for stablecoin payments in the country.

Bitcoin: BTC at risk of $75,000 reversal as Trump’s trade war overshadows US easing inflation
Bitcoin price remained constrained within a tight 8% channel between $76,000 and $84,472 this week. With conflicting market catalysts preventing prolonged directional swings, here are key factors that moved BTC prices this week, as well as key indicators to watch in the weeks ahead.

The Best brokers to trade EUR/USD
SPONSORED Discover the top brokers for trading EUR/USD in 2025. Our list features brokers with competitive spreads, fast execution, and powerful platforms. Whether you're a beginner or an expert, find the right partner to navigate the dynamic Forex market.