Bitcoin price analysis: Teasing ascending triangle breakdown, eyes on $ 8,600


  • Bitcoin targets two-week lows of 8,668, as technical set up turns bearish
  • Ascending triangle pattern on hourly sticks points to further downside.

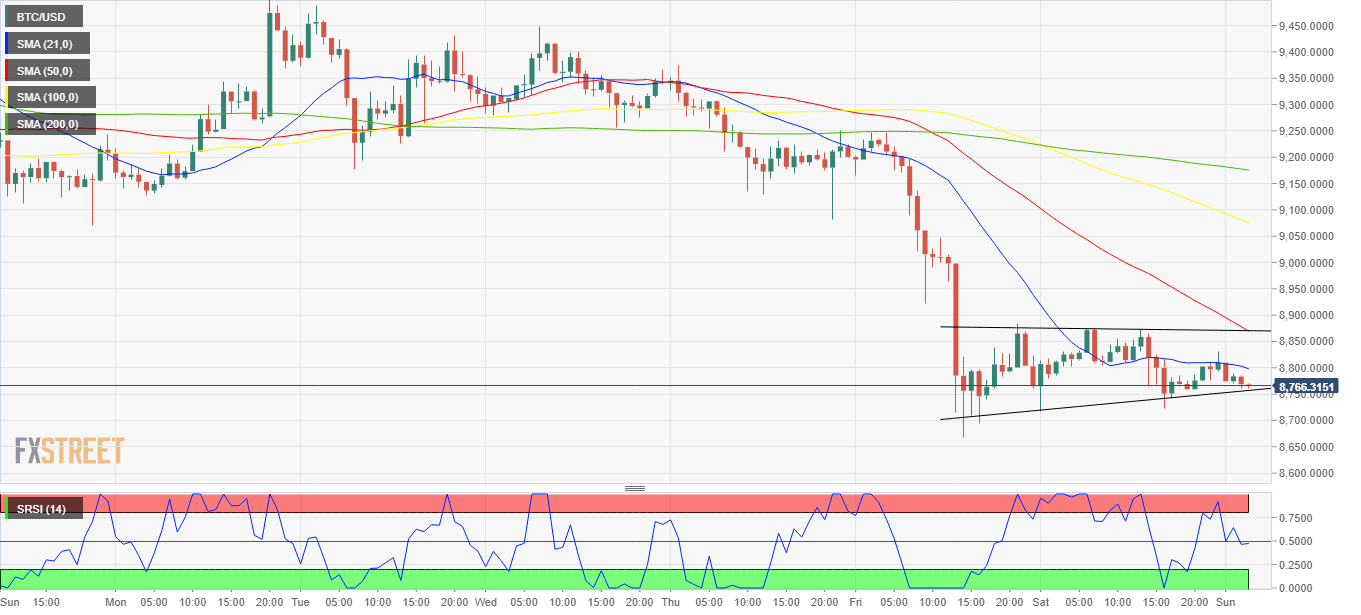
Bitcoin (BTC/USD), the most dominant cryptocurrency, reverses Saturday’s dead cat bounce from two-week lows of 8,668.60 as the sellers return in early Sunday trading. The recent profit-taking rally in the coin lost legs, as the technical charts painted a bearish picture amid a generalized downbeat tone seen across the crypto space so far this Sunday. At the time of writing, the No. 1 coin holds the lower ground near 8,750 region, down over 0.50% on the day while its market capitalization decreased slightly from $ 160.12 billion to $ 159.13 billion.

Technically, the spot extends its range play in a potential ascending triangle formation, now teasing the pattern breakdown, as it flirts with the rising trendline (pattern) support at 8,758. The selling pressure will intensify on the breakdown, opening floors towards a retest of the two-week lows reached last Friday. A failure to resist the last, the bears will target the next support at 8,600 (round number), below which the pattern target near 8,575 will come into play. The downside appears more compelling, as the price trades below all the key hourly Simple Moving Averages (HMA). Meanwhile, the hourly Relative Strength Index (RSI) has turned flat just below the midline, backing the bearish bias.

Should the coin manage to recover above the 21-HMA at 8,797, the bulls may attempt another run towards the 8,870 level, the confluence of the bearish 50-HMA and horizontal trendline (pattern) resistance.

All in all, the risks remain to the downside, as the weekend love appears to fade.

BTC/USD 1-hour chart

BTC/USD Levels to watch

BTC/USD

Overview
Today last price 8764.68
Today Daily Change -44.27
Today Daily Change % -0.50
Today daily open 8809.95
 
Trends
Daily SMA20 8791.34
Daily SMA50 8636.46
Daily SMA100 9573.04
Daily SMA200 9145.93
 
Levels
Previous Daily High 8874.74
Previous Daily Low 8717.29
Previous Weekly High 9580.19
Previous Weekly Low 8668.6
Previous Monthly High 10484.7
Previous Monthly Low 7300.54
Daily Fibonacci 38.2% 8814.6
Daily Fibonacci 61.8% 8777.44
Daily Pivot Point S1 8726.58
Daily Pivot Point S2 8643.21
Daily Pivot Point S3 8569.12
Daily Pivot Point R1 8884.03
Daily Pivot Point R2 8958.11
Daily Pivot Point R3 9041.48


Information on these pages contains forward-looking statements that involve risks and uncertainties. Markets and instruments profiled on this page are for informational purposes only and should not in any way come across as a recommendation to buy or sell in these assets. You should do your own thorough research before making any investment decisions. FXStreet does not in any way guarantee that this information is free from mistakes, errors, or material misstatements. It also does not guarantee that this information is of a timely nature. Investing in Open Markets involves a great deal of risk, including the loss of all or a portion of your investment, as well as emotional distress. All risks, losses and costs associated with investing, including total loss of principal, are your responsibility. The views and opinions expressed in this article are those of the authors and do not necessarily reflect the official policy or position of FXStreet nor its advertisers. The author will not be held responsible for information that is found at the end of links posted on this page.

If not otherwise explicitly mentioned in the body of the article, at the time of writing, the author has no position in any stock mentioned in this article and no business relationship with any company mentioned. The author has not received compensation for writing this article, other than from FXStreet.

FXStreet and the author do not provide personalized recommendations. The author makes no representations as to the accuracy, completeness, or suitability of this information. FXStreet and the author will not be liable for any errors, omissions or any losses, injuries or damages arising from this information and its display or use. Errors and omissions excepted.

The author and FXStreet are not registered investment advisors and nothing in this article is intended to be investment advice.

Recommended content


Recommended Content

Editors’ Picks

Bitcoin, Ethereum and XRP steady as China slaps 125% tariff on US, weekend sell-off looming?

Bitcoin, Ethereum and XRP steady as China slaps 125% tariff on US, weekend sell-off looming?

The Cryptocurrency market shows stability at the time of writing on Friday, with Bitcoin (BTC) holding steady at $82,584, Ethereum (ETH) at $1,569, and Ripple (XRP) maintaining its position above $2.00.

More Cryptocurrencies News
Bitcoin Weekly Forecast: Market uncertainty lingers, Trump’s 90-day tariff pause sparks modest recovery

Bitcoin Weekly Forecast: Market uncertainty lingers, Trump’s 90-day tariff pause sparks modest recovery

Bitcoin price extends recovery to around $82,500 on Friday after dumping to a new year-to-date low of $74,508 to start the week. Market uncertainty remains high, leading to a massive shakeout, with total liquidations hitting $2.18 billion across crypto markets.

More Bitcoin News
Bitcoin, Ethereum, Dogecoin and Cardano stabilze –  Why crypto is in limbo

Bitcoin, Ethereum, Dogecoin and Cardano stabilze –  Why crypto is in limbo

Bitcoin, Ethereum, Dogecoin and Cardano stabilize on Friday as crypto market capitalization steadies around $2.69 trillion. Crypto traders are recovering from the swing in token prices and the Monday bloodbath. 

More Cryptocurrencies News
Can FTX’s 186,000 unstaked SOL dampen Solana price breakout hopes?

Can FTX’s 186,000 unstaked SOL dampen Solana price breakout hopes?

Solana price edges higher and trades at $117.31 at the time of writing on Friday, marking a 3.4% increase from the $112.80 open. The smart contracts token corrected lower the previous day, following a sharp recovery to $120 induced by US President Donald Trump’s 90-day tariff pause on Wednesday.

More Solana News
Bitcoin Weekly Forecast: Tariff ‘Liberation Day’ sparks liquidation in crypto market

Bitcoin Weekly Forecast: Tariff ‘Liberation Day’ sparks liquidation in crypto market

Bitcoin (BTC) price remains under selling pressure and trades near $84,000 when writing on Friday after a rejection from a key resistance level earlier this week.

Read full analysis
The Best brokers to trade EUR/USD

The Best brokers to trade EUR/USD

SPONSORED Discover the top brokers for trading EUR/USD in 2025. Our list features brokers with competitive spreads, fast execution, and powerful platforms. Whether you're a beginner or an expert, find the right partner to navigate the dynamic Forex market.

Read More

BTC

ETH

XRP