Bitcoin Price Analysis: September may be turbulent for BTC, but who will win the battle?
- The data on the open interest for Bitcoin options implies a spike of volatility at the end of September.
- The price may retreat to $9,000 before it starts a long-term recovery towards $12,000.

Massive open interest in BTC options signals that the market may go wild into the end of September. The analytical data provider Skew noted a big cluster of the open interest in Bitcoin options with the expiry date at the end of the month, promising a spike of volatility.
Gearing up towards a pretty chunky #bitcoin options expiry at the end of the month, already $750mln open interest outstanding pic.twitter.com/hgFPzhFrrs
— skew (@skewdotcom) September 10, 2020
An open interest (OI) is an aggregate number of so-called open contracts on the market. It reflects market activity; however, it is neutral in terms of market sentiments. Basically, this indicator shows the potential strengths of the market movements but says nothing about the future price direction. Who has better chances to have the upper hand in the September battle between Bitcoin bulls and bears? Let's find it out.
Kraken sings September blues
The recent report published by the cryptocurrency exchange Kraken implies that Bitcoin's volatility will be decreasing in September, based on the historical data.
If history is any indicator of the future, bitcoin's volatility is likely to trend lower in the month ahead. September's 9-year average and median volatility of 61% and 45%, respectively, is the lowest among all other months.
Apart from that, the exchange experts believe that September may become the worst month for Bitcoin with an average return of -7%. If those expectations are correct, BTC may retest $9,000 by the end of the month.
Meanwhile, the S2F model paints a different picture, where Bitcoin is gearing up for a strong rally towards $18,000 by October and $31000 by the end of the year. Other signals of the growing bullish pressure include the increased stablecoins inflow to cryptocurrency exchanges. Read more details here.
Let's have a closer look at the long-term charts to access the technical stay of play and define BTC's pivotal level.
BTC/USD: The technical picture
On a weekly chart, BTC/USD is moving in an upside-looking channel. The price reached its upper boundary in August and, after numerous breakthrough attempts, reversed to the downside. The channel's lower line is currently at $9,500, and the price may retest it before the next bullish leg. If it gives way, the sell-off may be extended towards $9,000, reinforced by the weekly SMA50.
BTC/USD weekly chart
-637353439752641868.png)
Intotheblock's data on the market positioning also implies that the bears face stiff resistance in the area of $9,500-$9,000 as a cluster of over 3 million addresses holding 2.8 million BTC has a breakeven point around those levels. This massive supply from the traders who might seek to defend their positions before they move to the out-of-the-money cohort has the potential to slow down the bears and reverse the market.
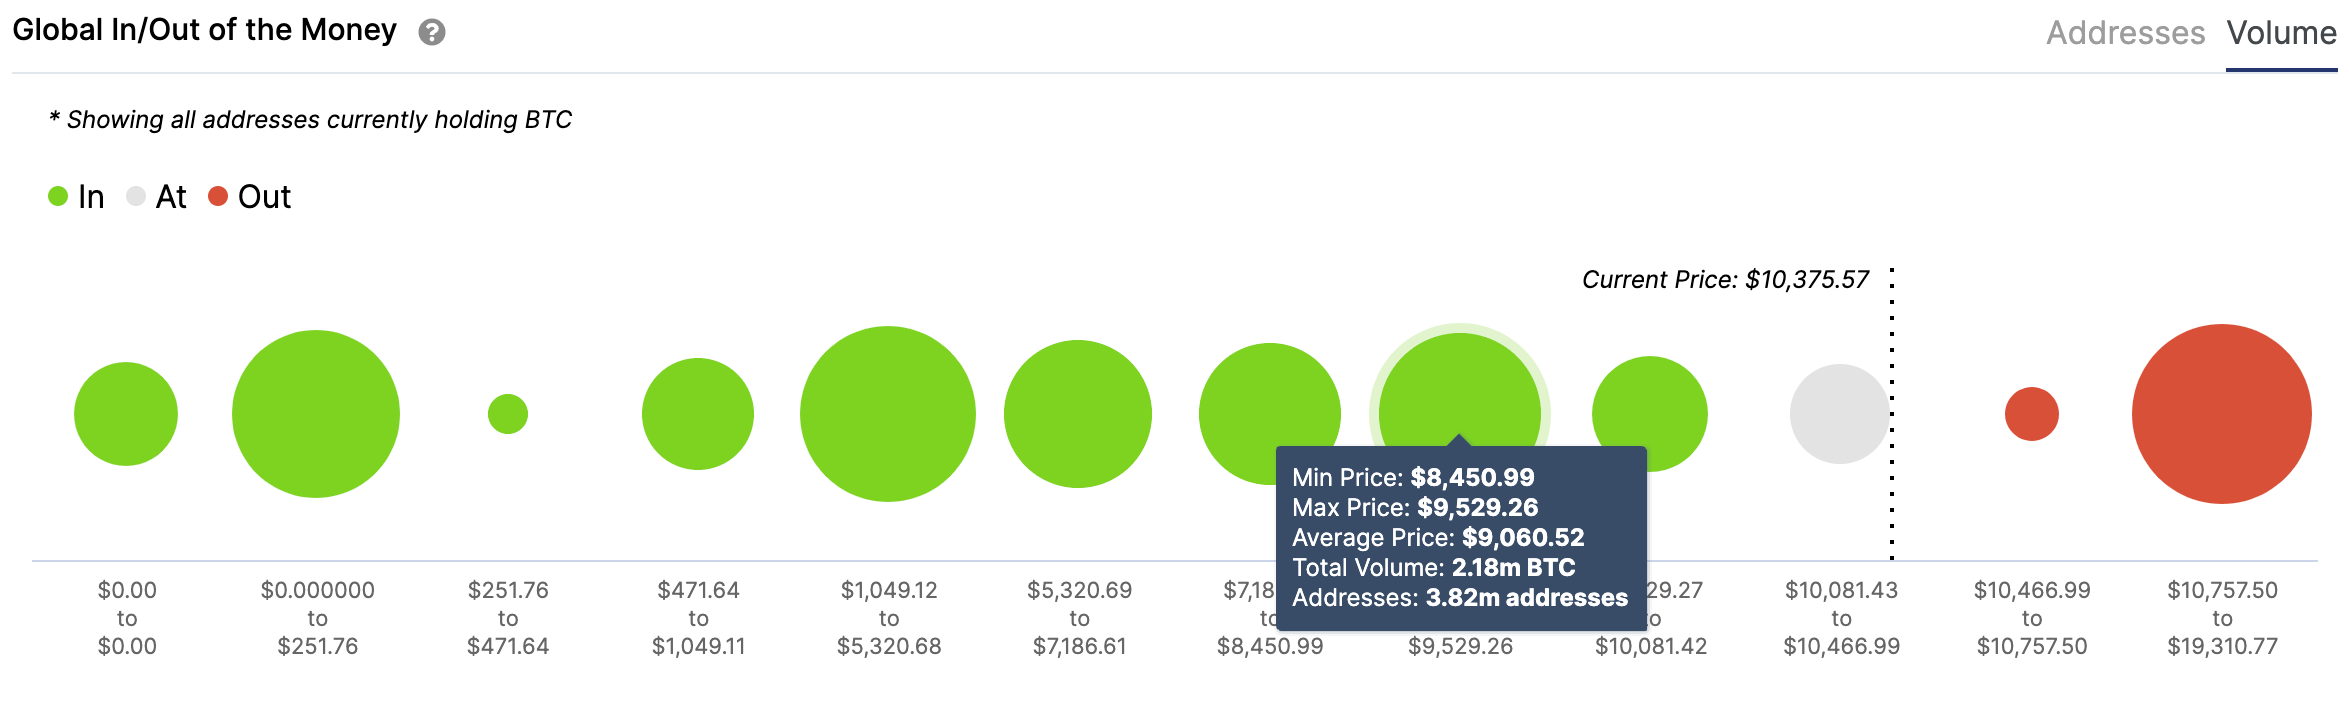
Source: Intotheblock
Meanwhile, we won't have any significant resistance on the way to the North until at least $12,000-$12,500. There is a small barrier in the area of 10,500-$10,750. It coincides with the upper boundary of the recent consolidation range at $10,500. As we have previously mentioned, as the sustainable move above this resistance level will take the price towards the broken upside trendline and the daily SMA50 at $11,100, the next focus is on the above-mentioned $12,000.
BTC/USD daily chart
-637353440266590765.png)
To conclude: A period of low volatility that followed a sharp sell-off at the beginning of September may result in a roller-coaster move at the end of the month. While it is hard to give long-term price targets for the pioneer cryptocurrency, the technical and on-chain data implies that the price may resume the recovery towards $12,000-$12,500 once $10,500 is cleared. On the other hand, the local support comes at $9,500 and followed by $9,000. The price may retest this supply area before the recovery is resumed. A sustainable move below $9,000 will negate the immediate bullish forecast and increase the chances of a deeper correction.
Author

Tanya Abrosimova
Independent Analyst


