- BTC/USD struggles to refresh all-time high marked the previous day.
- Bearish chart formation at the top becomes more powerful if confirmed.
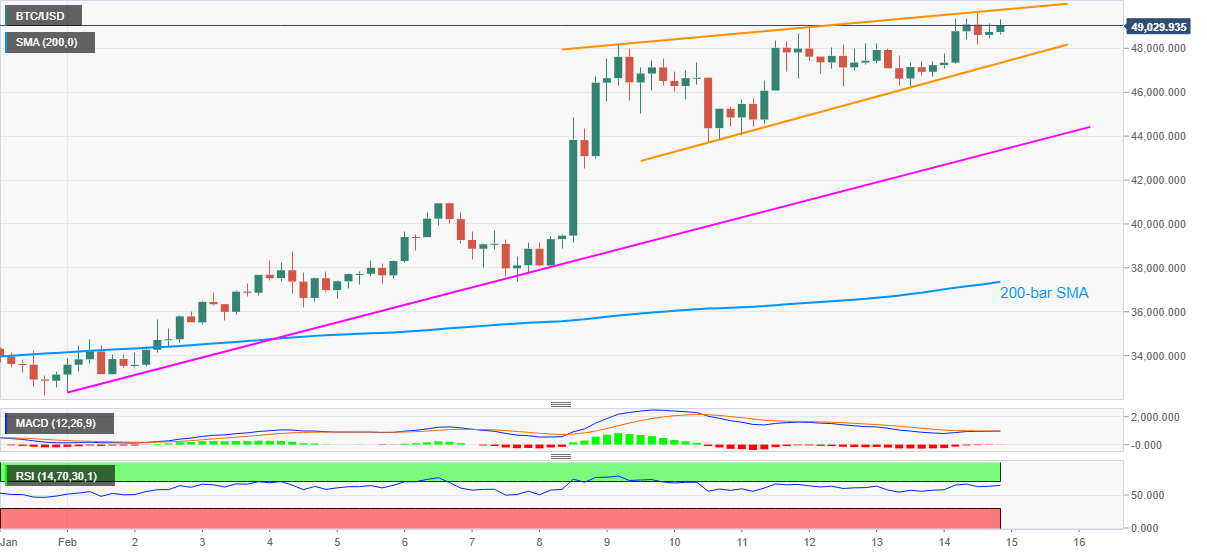
- MACD teases bulls but RSI nears overbought RSI, suggesting slow grind to the north.
- Monthly support line, 200-bar SMA adds to the downside filters.
BTC/USD fades upside momentum while easing to $49,000 during the early Monday’s trading. The cryptocurrency pair refreshed the record time the previous day while inching closer to the $50,000 threshold. However, the upper line of the bearish chart pattern, on the four-hour play, challenged the bitcoin bulls near $49,700.
While the rising wedge draws extra strength near the peak, MACD is flirting with the bulls. Also challenging the bearish chart formation could be the absence of the overbought RSI conditions, despite being near to the same.
As a result, BTC/USD traders may witness a slow grind towards the $50,000 threshold, with $49,750 acting as an immediate hurdle. However, any further upside will defy the bearish play and back the bulls cheering the market chatters over the $100,000 psychological magnet.
On the contrary, pullback moves may bounce off the stated pattern’s support line, currently near $47,300, failing to which will confirm the downside moves to the $40,000 threshold.
However, an upward sloping trend line from February 01, currently around $43,350, followed by the 200-bar SMA level of $37,365, can act as the extra bumps during the south-run.
Overall, BTC/USD remains the bull’s favorite despite the latest consolidation. Though, room for pullback can’t be ruled out, considering the bearish chart pattern.
BTC/USD daily chart
Trend: Pullback expected
Information on these pages contains forward-looking statements that involve risks and uncertainties. Markets and instruments profiled on this page are for informational purposes only and should not in any way come across as a recommendation to buy or sell in these assets. You should do your own thorough research before making any investment decisions. FXStreet does not in any way guarantee that this information is free from mistakes, errors, or material misstatements. It also does not guarantee that this information is of a timely nature. Investing in Open Markets involves a great deal of risk, including the loss of all or a portion of your investment, as well as emotional distress. All risks, losses and costs associated with investing, including total loss of principal, are your responsibility. The views and opinions expressed in this article are those of the authors and do not necessarily reflect the official policy or position of FXStreet nor its advertisers. The author will not be held responsible for information that is found at the end of links posted on this page.
If not otherwise explicitly mentioned in the body of the article, at the time of writing, the author has no position in any stock mentioned in this article and no business relationship with any company mentioned. The author has not received compensation for writing this article, other than from FXStreet.
FXStreet and the author do not provide personalized recommendations. The author makes no representations as to the accuracy, completeness, or suitability of this information. FXStreet and the author will not be liable for any errors, omissions or any losses, injuries or damages arising from this information and its display or use. Errors and omissions excepted.
The author and FXStreet are not registered investment advisors and nothing in this article is intended to be investment advice.
Recommended Content
Editors’ Picks

Bitcoin holds $84,000 despite Fed’s hawkish remarks and spot ETFs outflows
Bitcoin is stabilizing around $84,000 at the time of writing on Thursday after facing multiple rejections around the 200-day EMA at $85,000 since Saturday. Despite risk-off sentiment due to the hawkish remarks by the US Fed on Wednesday, BTC remains relatively stable.

Crypto market cap fell more than 18% in Q1, wiping out $633.5 billion after Trump’s inauguration top
CoinGecko’s Q1 Crypto Industry Report highlights that the total crypto market capitalization fell by 18.6% in the first quarter, wiping out $633.5 billion after topping on January 18, just a couple of days ahead of US President Donald Trump’s inauguration.

Top meme coin gainers FARTCOIN, AIDOGE, and MEW as Trump coins litmus test US SEC ethics
Cryptocurrencies have been moving in lockstep since Monday, largely reflecting sentiment across global markets as United States (US) President Donald Trump's tariffs and trade wars take on new shapes and forms each passing day.

XRP buoyant above $2 as court grants Ripple breathing space in SEC lawsuit
A US appellate court temporarily paused the SEC-Ripple case for 60 days, holding the appeal in abeyance. The SEC is expected to file a status report by June 15, signaling a potential end to the four-year legal battle.
Bitcoin Weekly Forecast: Market uncertainty lingers, Trump’s 90-day tariff pause sparks modest recovery
Bitcoin (BTC) price extends recovery to around $82,500 on Friday after dumping to a new year-to-date low of $74,508 to start the week. Market uncertainty remains high, leading to a massive shakeout, with total liquidations hitting $2.18 billion across crypto markets.

The Best brokers to trade EUR/USD
SPONSORED Discover the top brokers for trading EUR/USD in 2025. Our list features brokers with competitive spreads, fast execution, and powerful platforms. Whether you're a beginner or an expert, find the right partner to navigate the dynamic Forex market.