- BTC/USD reverses half the Friday’s sell-off, flashing green on Sunday.
- BTC bulls look to consolidate before the next push higher.
- Two consecutive Doji candles on daily chart to be a concern for the bulls?
Bitcoin (BTC/USD), the world’s largest cryptocurrency, consolidates Saturday’s sharp recovery from a drop to 5861.85 lows, as the bulls take a breather before the next push higher. The No.1 coin has reversed half the Friday’s slump to sub-5700 levels and now trades +2% near 6325 region after the recovery fizzled out near 6450. In Sunday’s trading so far, Bitcoin’s market capitalization has increased to $115.35 billion from about $112 billion seen on Saturday while it remains on track to book a 20% weekly gain.
Technical Overview
BTC/USD 1-hour chart
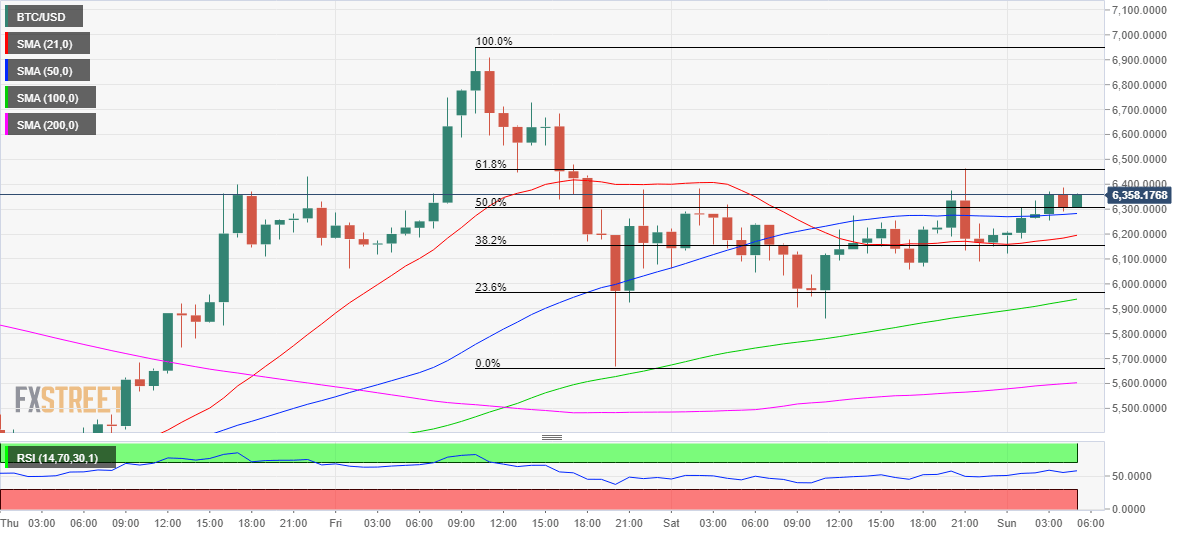
Technically, as observed on the hourly chart, the coin has risen back above all major Simple Moving Averages (HMA), with the immediate upside capped around 6450 region, the 61.8% Fibonacci Retracement level of Friday’s decline (from 6951.22 to 5666.65) and Saturday’s high. A sustained break above the aforementioned resistance will offer a fresh boost to the BTC bulls, as the recovery will regain traction towards a retest of the 7k mark. The hourly Relative Strength Index (RSI) is back above the midline and inches higher, still well below the overbought territory that points to the further upside in store.
On the flip side, the next support is aligned at the horizontal 50-HMA of 6282.45, below which the 6200 area will be tested, the confluence of the 38.2% Fib and upward sloping 21-HMA. Further south, if the 6000 phycological level gives way then the intersection of the 23.6% Fib and 100-HMA between 5965-5940 will come into play.
However, the upside looks more compelling above the 61.8% level amid a lack of key resistances limiting the bulls. Despite a more optimistic view in the near-term, the spot still remains exposed to downside risks, cautioned by the two consecutive Doji candles formed on the daily chart. Doji candlestick, usually, signals indecision and here it could suggest buyers’ exhaustion following a recovery from yearly lows of 3886.48 reached on March, 13th.
BTC/USD technical levels to watch
Information on these pages contains forward-looking statements that involve risks and uncertainties. Markets and instruments profiled on this page are for informational purposes only and should not in any way come across as a recommendation to buy or sell in these assets. You should do your own thorough research before making any investment decisions. FXStreet does not in any way guarantee that this information is free from mistakes, errors, or material misstatements. It also does not guarantee that this information is of a timely nature. Investing in Open Markets involves a great deal of risk, including the loss of all or a portion of your investment, as well as emotional distress. All risks, losses and costs associated with investing, including total loss of principal, are your responsibility. The views and opinions expressed in this article are those of the authors and do not necessarily reflect the official policy or position of FXStreet nor its advertisers. The author will not be held responsible for information that is found at the end of links posted on this page.
If not otherwise explicitly mentioned in the body of the article, at the time of writing, the author has no position in any stock mentioned in this article and no business relationship with any company mentioned. The author has not received compensation for writing this article, other than from FXStreet.
FXStreet and the author do not provide personalized recommendations. The author makes no representations as to the accuracy, completeness, or suitability of this information. FXStreet and the author will not be liable for any errors, omissions or any losses, injuries or damages arising from this information and its display or use. Errors and omissions excepted.
The author and FXStreet are not registered investment advisors and nothing in this article is intended to be investment advice.
Recommended Content
Editors’ Picks

Bitcoin holds $84,000 despite Fed’s hawkish remarks and spot ETFs outflows
Bitcoin is stabilizing around $84,000 at the time of writing on Thursday after facing multiple rejections around the 200-day EMA at $85,000 since Saturday. Despite risk-off sentiment due to the hawkish remarks by the US Fed on Wednesday, BTC remains relatively stable.

Crypto market cap fell more than 18% in Q1, wiping out $633.5 billion after Trump’s inauguration top
CoinGecko’s Q1 Crypto Industry Report highlights that the total crypto market capitalization fell by 18.6% in the first quarter, wiping out $633.5 billion after topping on January 18, just a couple of days ahead of US President Donald Trump’s inauguration.

Top meme coin gainers FARTCOIN, AIDOGE, and MEW as Trump coins litmus test US SEC ethics
Cryptocurrencies have been moving in lockstep since Monday, largely reflecting sentiment across global markets as United States (US) President Donald Trump's tariffs and trade wars take on new shapes and forms each passing day.

XRP buoyant above $2 as court grants Ripple breathing space in SEC lawsuit
A US appellate court temporarily paused the SEC-Ripple case for 60 days, holding the appeal in abeyance. The SEC is expected to file a status report by June 15, signaling a potential end to the four-year legal battle.
Bitcoin Weekly Forecast: Market uncertainty lingers, Trump’s 90-day tariff pause sparks modest recovery
Bitcoin (BTC) price extends recovery to around $82,500 on Friday after dumping to a new year-to-date low of $74,508 to start the week. Market uncertainty remains high, leading to a massive shakeout, with total liquidations hitting $2.18 billion across crypto markets.

The Best brokers to trade EUR/USD
SPONSORED Discover the top brokers for trading EUR/USD in 2025. Our list features brokers with competitive spreads, fast execution, and powerful platforms. Whether you're a beginner or an expert, find the right partner to navigate the dynamic Forex market.