Bitcoin Price Analysis: BTC/USD stages a quick bounce above $50,000 after the 11% sell-off


The wild ride in Bitcoin continues in Tuesday’s Asian trading, as the BTC sellers are back in control, knocking off prices by almost 11%.

Although, strong bids emerged just above $48,500 levels, prompting the flagship cryptocurrency to stage a quick recovery back beyond the $50,000 mark.

The volatility around the most favorite digital remains elevated, as markets rethink the recent record rally, in the wake of the cautious comments from US Treasury Secretary Janet Yellen, Tesla’s founder Elon Musk and Microsoft co-founder Bill Gates.

Billionaire Elon Musk tweeted last Saturday that its value ‘seems high’ last Saturday. Meanwhile, Yellen said that the granddaddy of cryptocurrencies is extremely inefficient for conducting transactions. Her comments triggered Monday’s 17% flash crash from near-record highs reached at $58,367 on Sunday, as the rates fell as low as $47,821.

Bitcoin holds above the critical 21-DMA support

Despite the renewed sell-off, the BTC bulls have managed to defend the critical support of the bullish 21-daily moving average (DMA) at $47,336. Should the latter cave in, Bitcoin could see a fresh decline towards the 50-DMA at $40,287.  

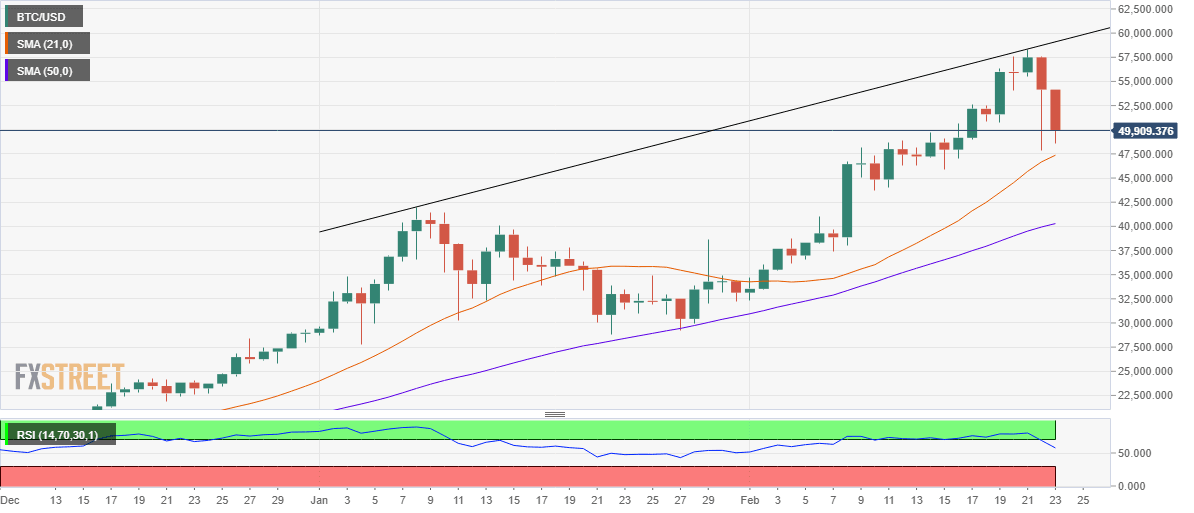
BTC/USD: Daily chart

On the flipside, the record highs could be back on the buyers’ radars, if they manage to find a foothold above the $50K mark. The critical barrier awaits at the rising trendline resistance of $59,098.

The 14-day Relative Strength Index (RSI) has turned south but holds above the midline, keeping doors open towards the all-time-highs.

BTC/USD additional levels

BTC/USD

Overview
Today last price 50,305
Today Daily Change -4185.82
Today Daily Change % -7.73
Today daily open 54155.99
 
Trends
Daily SMA20 47233.46
Daily SMA50 39930.96
Daily SMA100 30609.45
Daily SMA200 21267.35
 
Levels
Previous Daily High 57567.85
Previous Daily Low 47821.6
Previous Weekly High 56348.35
Previous Weekly Low 45855.52
Previous Monthly High 41987.21
Previous Monthly Low 27772
Daily Fibonacci 38.2% 51544.67
Daily Fibonacci 61.8% 53844.78
Daily Pivot Point S1 48795.78
Daily Pivot Point S2 43435.56
Daily Pivot Point S3 39049.52
Daily Pivot Point R1 58542.03
Daily Pivot Point R2 62928.07
Daily Pivot Point R3 68288.29


Information on these pages contains forward-looking statements that involve risks and uncertainties. Markets and instruments profiled on this page are for informational purposes only and should not in any way come across as a recommendation to buy or sell in these assets. You should do your own thorough research before making any investment decisions. FXStreet does not in any way guarantee that this information is free from mistakes, errors, or material misstatements. It also does not guarantee that this information is of a timely nature. Investing in Open Markets involves a great deal of risk, including the loss of all or a portion of your investment, as well as emotional distress. All risks, losses and costs associated with investing, including total loss of principal, are your responsibility. The views and opinions expressed in this article are those of the authors and do not necessarily reflect the official policy or position of FXStreet nor its advertisers. The author will not be held responsible for information that is found at the end of links posted on this page.

If not otherwise explicitly mentioned in the body of the article, at the time of writing, the author has no position in any stock mentioned in this article and no business relationship with any company mentioned. The author has not received compensation for writing this article, other than from FXStreet.

FXStreet and the author do not provide personalized recommendations. The author makes no representations as to the accuracy, completeness, or suitability of this information. FXStreet and the author will not be liable for any errors, omissions or any losses, injuries or damages arising from this information and its display or use. Errors and omissions excepted.

The author and FXStreet are not registered investment advisors and nothing in this article is intended to be investment advice.

Join Telegram

Recommended content


Recommended Content

Editors’ Picks

Ripple on-chain metrics show bullish signs amidst legal struggle with SEC, XRP eyes recovery

Ripple on-chain metrics show bullish signs amidst legal struggle with SEC, XRP eyes recovery

Ripple made a comeback above $0.48 on Tuesday and hovers above that level in Wednesday’s European session. Ripple on-chain metrics such as transaction volume and Network Realized Profit/Loss have turned bullish, supporting a recovery in the altcoin. 

More Ripple News

Bitcoin price falls amidst German government transfers, miners activity

Bitcoin price falls amidst German government transfers, miners activity

Bitcoin (BTC) extends correction on Wednesday and hovers around $61,000 after finding resistance near the $64,000 level on Monday. Recent on-chain data indicates heightened selling activity from Bitcoin miners early in the week. 

More Bitcoin News

Crypto Today: Bitcoin erases gains from end of June, Ethereum declines while Ripple holds

Crypto Today: Bitcoin erases gains from end of June, Ethereum declines while Ripple holds

Bitcoin wipes out gains from the last week of June and falls below $60,000 on Wednesday. Ethereum and top altcoins ranked by market capitalization erased gains as the inflation outlook worsened. Ripple holds on to recent gains and hovers above $0.48 on Wednesday. 

More Cryptocurrencies News

Three reasons why altcoins could shake off losses this week

Three reasons why altcoins could shake off losses this week

On-chain data from Santiment shows that altcoins are currently in the opportunity zone, or generating buy signals. The top three altcoins in the buy zone are Basic Attention Token (BAT), Chromia (CHR), and Highstreet (HIGH), per Santiment. 

More Altcoins News

Bitcoin: BTC price correction could end in July, according to seasonal data

Bitcoin: BTC price correction could end in July, according to seasonal data

Bitcoin (BTC) price appears poised for a decline this week, influenced by slight outflows in US spot ETFs, selling activity among BTC miners, and a combined transfer of 4,690.28 BTC to centralized exchanges by the US and German governments.

Read full analysis

BTC

ETH

XRP