- BTC/USD stays pressured around short-term key support after three-week downtrend.
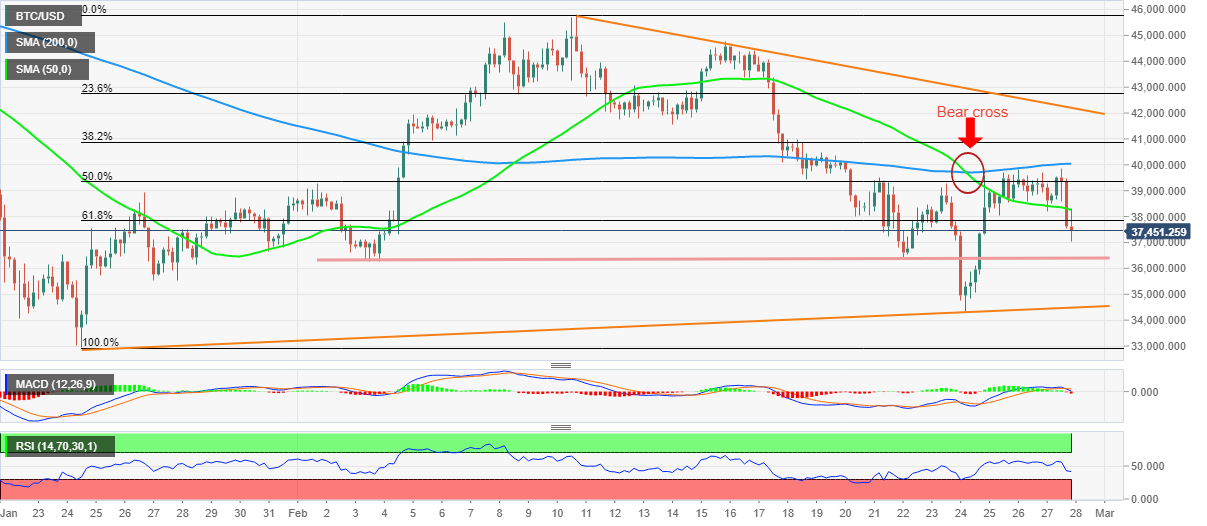
- Bear cross, downbeat oscillators keep sellers hopeful around 61.8% Fibonacci retracement level.
- Five-week-old ascending trend line support may test the bears nearby horizontal line.
- Russian nuclear arsenal on high alert even as Kyiv-Moscow agrees for peace talks.
BTC/USD seesaws around $36,700 during the late Sunday’s trading, after declining for three consecutive weeks in the last.
In doing so, the Bitcoin pair makes rounds to the 61.8% Fibonacci retracement (Fibo.) of the quote’s upside from late January to February 10.
However, 50-SMA’s downside break of the 200-SMA, known as a bear cross, joins the downbeat RSI line and bearish MACD signals to hint at the crypto major’s further downside.
That said, three-week-old horizontal support around $36,300 may restrict the BTC/USD pair’s immediate downside ahead of an upward sloping trend line from January 24, near $34,500 by the press time.
Following that, the late January low near $32,950 will be in focus.
Alternatively, recovery moves need to provide a decisive break above the 200-SMA level of $40,043 to push back the short-term sellers.
Even so, BTC/USD bulls will remain cautious until the pair stays below a descending trend line from February 10, close to $42,000 by the press time.
Read: Risk-off start to week: Russia's Putin puts nuclear deterrence forces on high alert
BTC/USD: Four-hour chart
Trend: Further weakness eyed
Information on these pages contains forward-looking statements that involve risks and uncertainties. Markets and instruments profiled on this page are for informational purposes only and should not in any way come across as a recommendation to buy or sell in these assets. You should do your own thorough research before making any investment decisions. FXStreet does not in any way guarantee that this information is free from mistakes, errors, or material misstatements. It also does not guarantee that this information is of a timely nature. Investing in Open Markets involves a great deal of risk, including the loss of all or a portion of your investment, as well as emotional distress. All risks, losses and costs associated with investing, including total loss of principal, are your responsibility. The views and opinions expressed in this article are those of the authors and do not necessarily reflect the official policy or position of FXStreet nor its advertisers. The author will not be held responsible for information that is found at the end of links posted on this page.
If not otherwise explicitly mentioned in the body of the article, at the time of writing, the author has no position in any stock mentioned in this article and no business relationship with any company mentioned. The author has not received compensation for writing this article, other than from FXStreet.
FXStreet and the author do not provide personalized recommendations. The author makes no representations as to the accuracy, completeness, or suitability of this information. FXStreet and the author will not be liable for any errors, omissions or any losses, injuries or damages arising from this information and its display or use. Errors and omissions excepted.
The author and FXStreet are not registered investment advisors and nothing in this article is intended to be investment advice.
Recommended Content
Editors’ Picks

Bitcoin, Ethereum and XRP steady as China slaps 125% tariff on US, weekend sell-off looming?
The Cryptocurrency market shows stability at the time of writing on Friday, with Bitcoin (BTC) holding steady at $82,584, Ethereum (ETH) at $1,569, and Ripple (XRP) maintaining its position above $2.00.

Bitcoin Weekly Forecast: Market uncertainty lingers, Trump’s 90-day tariff pause sparks modest recovery
Bitcoin price extends recovery to around $82,500 on Friday after dumping to a new year-to-date low of $74,508 to start the week. Market uncertainty remains high, leading to a massive shakeout, with total liquidations hitting $2.18 billion across crypto markets.

Bitcoin, Ethereum, Dogecoin and Cardano stabilze – Why crypto is in limbo
Bitcoin, Ethereum, Dogecoin and Cardano stabilize on Friday as crypto market capitalization steadies around $2.69 trillion. Crypto traders are recovering from the swing in token prices and the Monday bloodbath.

Can FTX’s 186,000 unstaked SOL dampen Solana price breakout hopes?
Solana price edges higher and trades at $117.31 at the time of writing on Friday, marking a 3.4% increase from the $112.80 open. The smart contracts token corrected lower the previous day, following a sharp recovery to $120 induced by US President Donald Trump’s 90-day tariff pause on Wednesday.
Bitcoin Weekly Forecast: Market uncertainty lingers, Trump’s 90-day tariff pause sparks modest recovery
Bitcoin (BTC) price extends recovery to around $82,500 on Friday after dumping to a new year-to-date low of $74,508 to start the week. Market uncertainty remains high, leading to a massive shakeout, with total liquidations hitting $2.18 billion across crypto markets.

The Best brokers to trade EUR/USD
SPONSORED Discover the top brokers for trading EUR/USD in 2025. Our list features brokers with competitive spreads, fast execution, and powerful platforms. Whether you're a beginner or an expert, find the right partner to navigate the dynamic Forex market.