|

Bitcoin Price Analysis: BTC/USD consolidates below the red Ichimoku cloud

  • The RSI indicator is trending at the edge of the overbought zone.
  • The Elliott Oscillator has had two straight red sessions, following 11 consecutive green sessions.

BTC/USD daily chart

BTC/USD daily chart

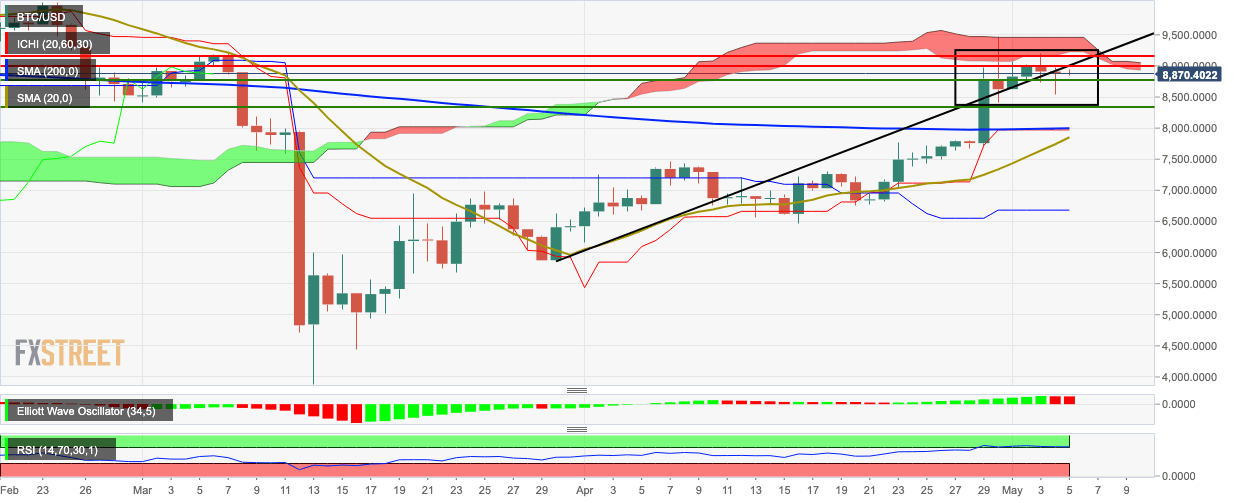
BTC/USD bears remained in control for the third straight day as the price dropped from $8,886 to $8,864. This Monday, the price broke below the upward trending line and it has moved horizontally since then. The daily BTC/USD price is consolidating below the red Ichimoku cloud. The SMA 20 is about to cross over the SMA 200, to potentially chart a bullish cross. The Elliott Oscillator has had two red sessions following 11 consecutive green sessions. The RSI indicator is trending at the edge of the overbought zone, which means that more bearish correction may be around the corner.

BTC/USD hourly chart

BTC/USD hourly chart

The hourly BTC/USD chart shows a tug of war between bulls and bears. The price had dipped from $8,911.30, all the way down to $8,620. The buyers then found some much-needed support and broke past key levels at $8,703 and $8,842.35. The bulls eventually ran out of momentum at the $8,959.35 resistance level and dropped down.

Key levels

BTC/USD

Overview
Today last price8884.35
Today Daily Change0.27
Today Daily Change %0.00
Today daily open8884.08
 
Trends
Daily SMA207740.99
Daily SMA507010.65
Daily SMA1007998.99
Daily SMA2007979.7
 
Levels
Previous Daily High8971.17
Previous Daily Low8535.49
Previous Weekly High9476.83
Previous Weekly Low7491.5
Previous Monthly High9476.83
Previous Monthly Low6156.67
Daily Fibonacci 38.2%8701.92
Daily Fibonacci 61.8%8804.74
Daily Pivot Point S18622.66
Daily Pivot Point S28361.24
Daily Pivot Point S38186.98
Daily Pivot Point R19058.34
Daily Pivot Point R29232.6
Daily Pivot Point R39494.02


Author

Rajarshi Mitra

Rajarshi Mitra

Independent Analyst

Rajarshi entered the blockchain space in 2016. He is a blockchain researcher who has worked for Blockgeeks and has done research work for several ICOs. He gets regularly invited to give talks on the blockchain technology and cryptocurrencies.

More from Rajarshi Mitra
Share:

Editor's Picks

XRP pressured by weak ETF flows and declining retail interest

Ripple (XRP) is edging lower, trading above its intraday low of $1.32 at the time of writing on Tuesday. The decline from its weekly opening of $1.39 reflects heightened volatility in the broader cryptocurrency market, accentuated by tariff-triggered uncertainty.

Crypto Today: Bitcoin, Ethereum, XRP come under renewed pressure amid ETF outflows, tariff uncertainty

Bitcoin, Ethereum and Ripple are trading under increasing selling pressure at the time of writing on Tuesday, as market participants navigate renewed tariff uncertainty. The Crypto King holds above $63,000, down 2% intraday from its $64,656 open.

Bitcoin falls to two-week low as ETF outflows, tariff chaos weigh

Bitcoin price extends losses on Tuesday, ending a two-week consolidation phase. Risk-on sentiment fades amid growing uncertainty over Trump’s tariffs and rising US-Iran tensions, increasing downside risks toward $60,000.

Sui Price Forecast: SUI capitulates under pressure, opens the door to $0.70

Sui (SUI) declines by 3% at press time on Tuesday, extending the downside breakout of a short-consolidation range confirmed the previous day. Retail sentiment is bearish, as evidenced by increased long liquidations and a sharp drop in the funding rate. 

Bitcoin Price Annual Forecast: BTC holds long-term bullish structure heading into 2026

Bitcoin (BTC) is wrapping up 2025 as one of its most eventful years, defined by unprecedented institutional participation, major regulatory developments, and extreme price volatility.

Bitcoin: No recovery in sight

Bitcoin (BTC) price continues to trade within a range-bound zone, hovering around $67,000 at the time of writing on Friday, and falling slightly so far this week, with no signs of recovery.