Bitcoin Price Analysis: BTC/USD a step away from smashing through $9000
- Bitcoin price is trading in the red, down some -0.90% in the second half of the session.
- BTC/USD is flirting with a critical daily support area, $8600-500 range.
- The bulls briefly touched the $9000 territory over the weekend, however, it proved to be short-lived.

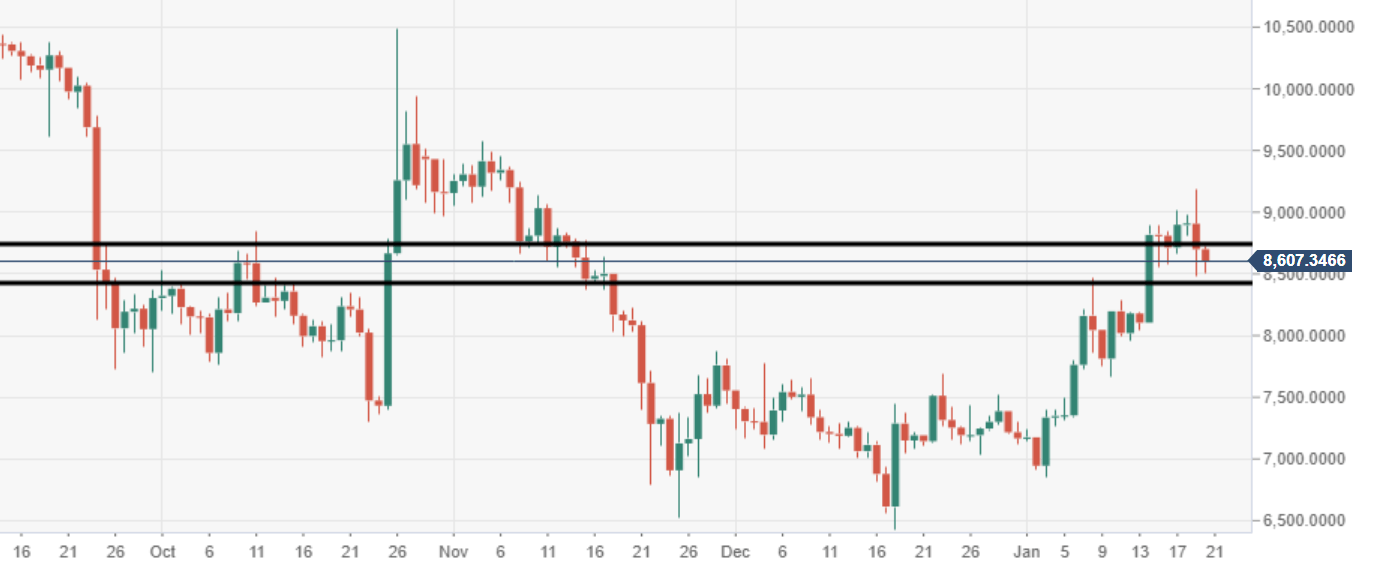
BTC/USD daily chart
The price is sitting on critical daily support, failure to hold would invite a strong wave of selling pressure. It should be noted at $8600-500 range.
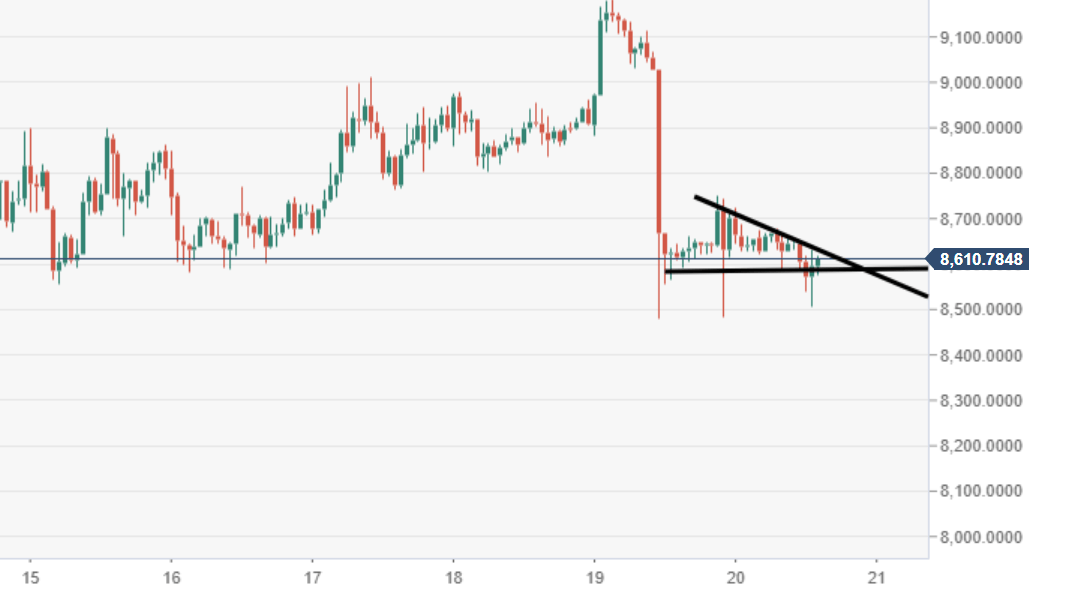
BTC/USD 60-minute chart
Price action is moving within a potential bearish pennant structure, subject to a breakout south. It is also worth noting that this $8600-500 is a decent demand zone, there may be room for the bulls to escape.
Spot rate: 8617.63
Relative change: -0.90%
High: 8723.83
Low: 8583.73
Author

Ken Chigbo
Independent Analyst
Ken has over 8 years exposure to the financial markets. He started his career as an analyst, covering a variety of asset classes; forex, fixed income, commodities and equities.
More from Ken Chigbo


