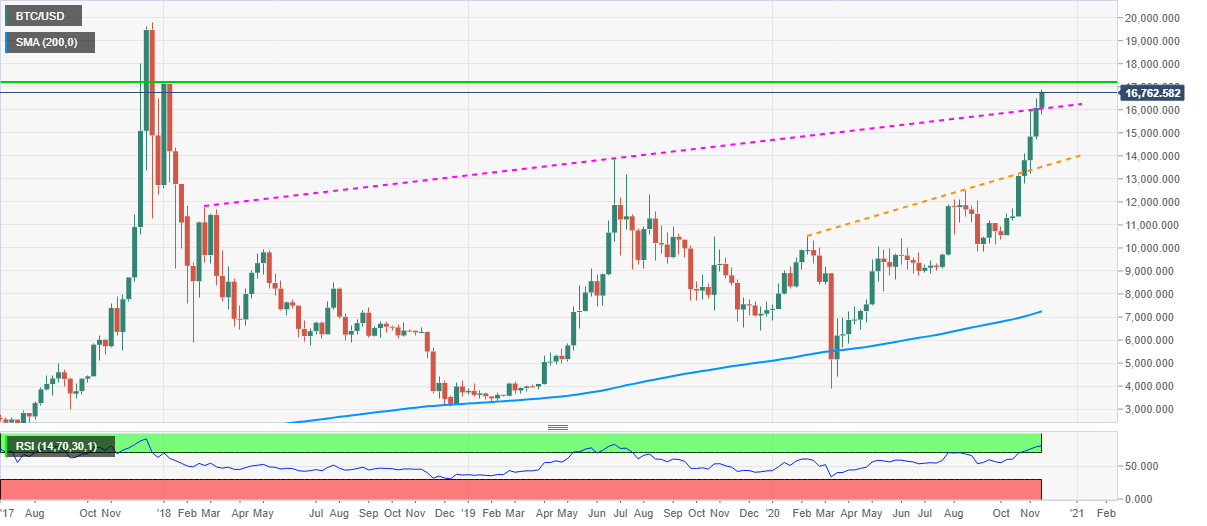
• BTC/USD eases from the intraday high, keeps upside break of 33-month-old rising trend line.
  • Overbought RSI suggests corrective pullback towards Friday’s top.

BTC/USD drops to 16,759 during early Tuesday. Even so, the Crypto major prints 0.18% intraday gains while nearing the highest levels since January 2018, flashed last week.

Although overbought RSI conditions on the weekly chart suggest the pair’s corrective pullback towards Friday’s high near 16,490, any further declines are less likely.

Also acting as the key downside support is an ascending trend line from late-February 2018, currently around 16,040 and the 16,000 round-figures.

Alternatively, the 17,000 round-figure can offer immediate resistance to the quote ahead of lighting the highs marked during early 2018, surrounding 17,200.

In a case where the BTC/USD bulls stay positive beyond 17,200, the year 217 peak surrounding 19,800 could return to the chart.

BTC/USD weekly chart

Trend: Bullish

Additional important levels

Overview
Today last price 16819.07
Today Daily Change 95.15
Today Daily Change % 0.57%
Today daily open 16723.92
 
Trends
Daily SMA20 14948.09
Daily SMA50 12918.11
Daily SMA100 12018.37
Daily SMA200 10814.97
 
Levels
Previous Daily High 16891.33
Previous Daily Low 15879.31
Previous Weekly High 16490.58
Previous Weekly Low 14729.64
Previous Monthly High 14089.91
Previous Monthly Low 10376.73
Daily Fibonacci 38.2% 16504.74
Daily Fibonacci 61.8% 16265.9
Daily Pivot Point S1 16105.04
Daily Pivot Point S2 15486.16
Daily Pivot Point S3 15093.01
Daily Pivot Point R1 17117.06
Daily Pivot Point R2 17510.21
Daily Pivot Point R3 18129.09


Information on these pages contains forward-looking statements that involve risks and uncertainties. Markets and instruments profiled on this page are for informational purposes only and should not in any way come across as a recommendation to buy or sell in these assets. You should do your own thorough research before making any investment decisions. FXStreet does not in any way guarantee that this information is free from mistakes, errors, or material misstatements. It also does not guarantee that this information is of a timely nature. Investing in Open Markets involves a great deal of risk, including the loss of all or a portion of your investment, as well as emotional distress. All risks, losses and costs associated with investing, including total loss of principal, are your responsibility. The views and opinions expressed in this article are those of the authors and do not necessarily reflect the official policy or position of FXStreet nor its advertisers. The author will not be held responsible for information that is found at the end of links posted on this page.

If not otherwise explicitly mentioned in the body of the article, at the time of writing, the author has no position in any stock mentioned in this article and no business relationship with any company mentioned. The author has not received compensation for writing this article, other than from FXStreet.

FXStreet and the author do not provide personalized recommendations. The author makes no representations as to the accuracy, completeness, or suitability of this information. FXStreet and the author will not be liable for any errors, omissions or any losses, injuries or damages arising from this information and its display or use. Errors and omissions excepted.

The author and FXStreet are not registered investment advisors and nothing in this article is intended to be investment advice.

Recommended content


Recommended Content

Editors’ Picks

PEPE Price Forecast: PEPE could rally to double digits if it breaks above its key resistance level

PEPE Price Forecast: PEPE could rally to double digits if it breaks above its key resistance level

Pepe (PEPE) memecoin approaches its descending trendline, trading around $0.000007 on Tuesday; a breakout indicates a bullish move ahead.

More Pepe News
Tron Price Prediction: Tether’s $1B move triggers TRX ahead of US Congress stablecoin bill review on Wednesday

Tron Price Prediction: Tether’s $1B move triggers TRX ahead of US Congress stablecoin bill review on Wednesday

Tron price defied the broader crypto market downtrend, surging 3% to $0.25 on Monday. This bullish momentum comes as stablecoin issuer Tether minted another $1 billion worth of USDT on the Tron network, according to on-chain data from Arkham.

More Tron News
Ethereum Price Forecast: Short-term holders spark $400 million in realized losses, staking flows surge

Ethereum Price Forecast: Short-term holders spark $400 million in realized losses, staking flows surge

Ethereum (ETH) bounced off the $1,800 support on Monday following increased selling pressure from short-term holders (STHs) and tensions surrounding President Donald Trump's reciprocal tariff kick-off on April 2.

More Ethereum News
BlackRock CEO warns Bitcoin could replace US Dollar as global reserve currency, crypto ETFs witness inflows

BlackRock CEO warns Bitcoin could replace US Dollar as global reserve currency, crypto ETFs witness inflows

BlackRock CEO Larry Fink stated in an annual letter to investors on Monday that the US national debt could cause the Dollar's global reserve status to be replaced with Bitcoin if investors begin to see the digital currency as a safer asset.

More Cryptocurrencies News
Bitcoin: BTC remains calm before a storm

Bitcoin: BTC remains calm before a storm

Bitcoin's price has been consolidating between $85,000 and $88,000 this week. A K33 report explains how the markets are relatively calm and shaping up for volatility as traders absorb the tariff announcements. PlanB’s S2F model shows that Bitcoin looks extremely undervalued compared to Gold and the housing market.

Read full analysis
The Best brokers to trade EUR/USD

The Best brokers to trade EUR/USD

SPONSORED Discover the top brokers for trading EUR/USD in 2025. Our list features brokers with competitive spreads, fast execution, and powerful platforms. Whether you're a beginner or an expert, find the right partner to navigate the dynamic Forex market.

Read More

BTC

ETH

XRP