|

Bitcoin Price Analysis: BTC rejects technical level and breaks down

  • Bitcoin pulled back from a long term trendline.
  • BTC/USD has just turned positive after trading lower for most of the session.
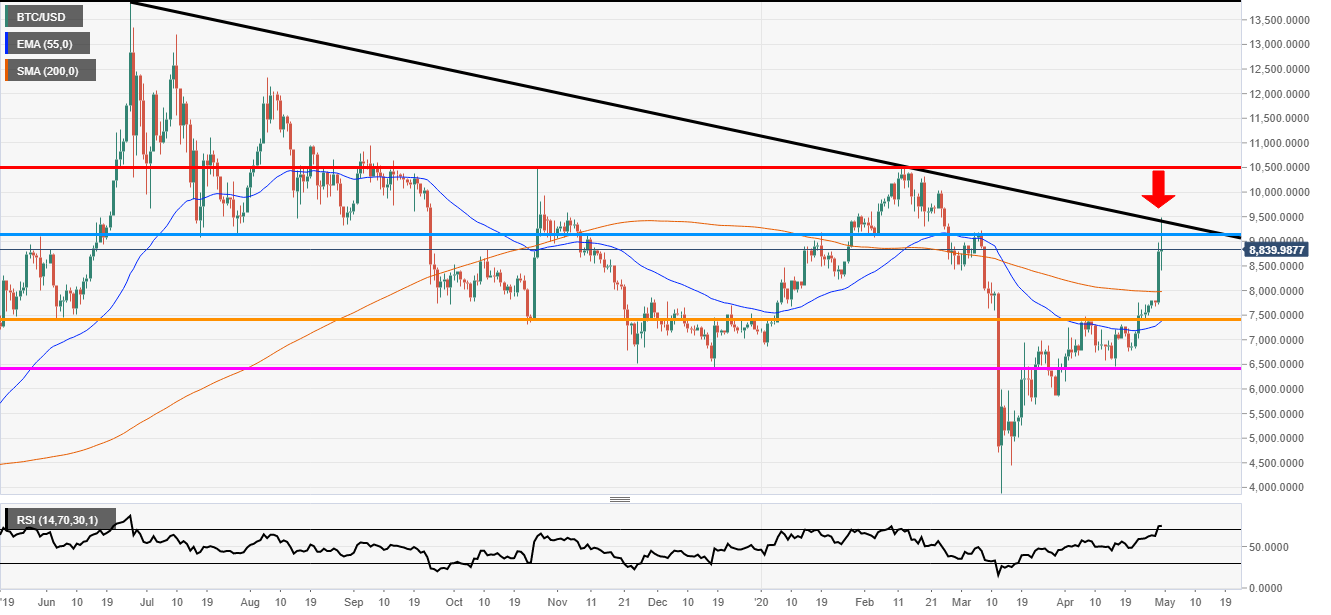
BTC/USD daily chart

Bitcoin had a massive Wednesday jumping over 13%. On Thursday, the market moved higher earlier in the session but since it dropped lower to hit a session low of 8,407.00. Now the price is trading just above flat and the bulls could be taking control again.

The price stopped at a key technical level. Looking at the chart the black trendline had been rejected and the price also stopped at the blue horizontal line at 9,152.00. Although it is not on the chart the price line is also close to the 50% Fibonacci level.

Now it is up to the bulls and bears to fight it out for dominance over this market. The bulls have the longer-term control as the market continues to make higher lows and higher highs. But this level does seem strong and it may take some decent volume to crack it.

Bitcoin hits technical resistance

Additional levels

BTC/USD

Overview
Today last price8853.22
Today Daily Change62.56
Today Daily Change %0.71
Today daily open8790.66
 
Trends
Daily SMA207249.78
Daily SMA506704.11
Daily SMA1007981.83
Daily SMA2007967.54
 
Levels
Previous Daily High8978.23
Previous Daily Low7721.44
Previous Weekly High7765.01
Previous Weekly Low6754.64
Previous Monthly High9215.51
Previous Monthly Low3886.49
Daily Fibonacci 38.2%8498.13
Daily Fibonacci 61.8%8201.53
Daily Pivot Point S18015.32
Daily Pivot Point S27239.98
Daily Pivot Point S36758.53
Daily Pivot Point R19272.11
Daily Pivot Point R29753.57
Daily Pivot Point R310528.91

Author

Rajan Dhall, MSTA

Rajan Dhall is an experienced market analyst, who has been trading professionally since 2007 managing various funds producing exceptional returns.

More from Rajan Dhall, MSTA
Share:

Editor's Picks

Ripple exposed to volatility amid low retail interest, modest fund inflows

Ripple (XRP) is extending its intraday decline to around $1.40 at the time of writing on Monday amid growing pressure from the retail market and risk-off sentiment that continues to keep investors on the sidelines.

Crypto Today: Bitcoin steadies around $70,000, Ethereum and XRP remain under pressure 

Bitcoin hovers around $70,000, up near 15% from last week's low of $60,000 despite low retail demand. Ethereum delicately holds $2,000 support as weak technicals weigh amid declining futures Open Interest.

Pi Network extends decline as steady mainnet migration adds pressure

PI edges lower by over 3% at press time on Monday, marking a third consecutive day of losses. The declining trend in PI aligns with the steady mainnet migration of PI tokens, which may fuel selling pressure. The technical outlook for PI remains bearish, with bearish momentum persisting. 

Bitcoin slips below $70,000 as ETF outflows, realized losses fuel bearish outlook

Bitcoin price trades in red below $70,000 on Monday after correcting nearly 9% in the previous week. US-listed spot ETFs recorded a $318 million weekly outflow, marking the third consecutive week of withdrawals.

Bitcoin Price Annual Forecast: BTC holds long-term bullish structure heading into 2026

Bitcoin (BTC) is wrapping up 2025 as one of its most eventful years, defined by unprecedented institutional participation, major regulatory developments, and extreme price volatility.

Bitcoin: The worst may be behind us

Bitcoin (BTC) price recovers slightly, trading at $65,000 at the time of writing on Friday, after reaching a low of $60,000 during the early Asian trading session. The Crypto King remained under pressure so far this week, posting three consecutive weeks of losses exceeding 30%.