• Bitcoin is ready for a technical correction before another upside wave.
  • IOMP data implies that the upside is the path of least resistance for BTC.

Bitcoin (BTC) has settled above $13,000; however, further growth seems to be limited. The pioneer digital coin hit the recent high of $13,361 on October 25 and retreated to $13,110 by the time of writing. The coin has gained over 1.6% in recent 24 hours and over 14% on a week-to-week basis.  

Bitcoin's average daily trading volume is at $24.3 billion, while its market share settled at 61.2%.

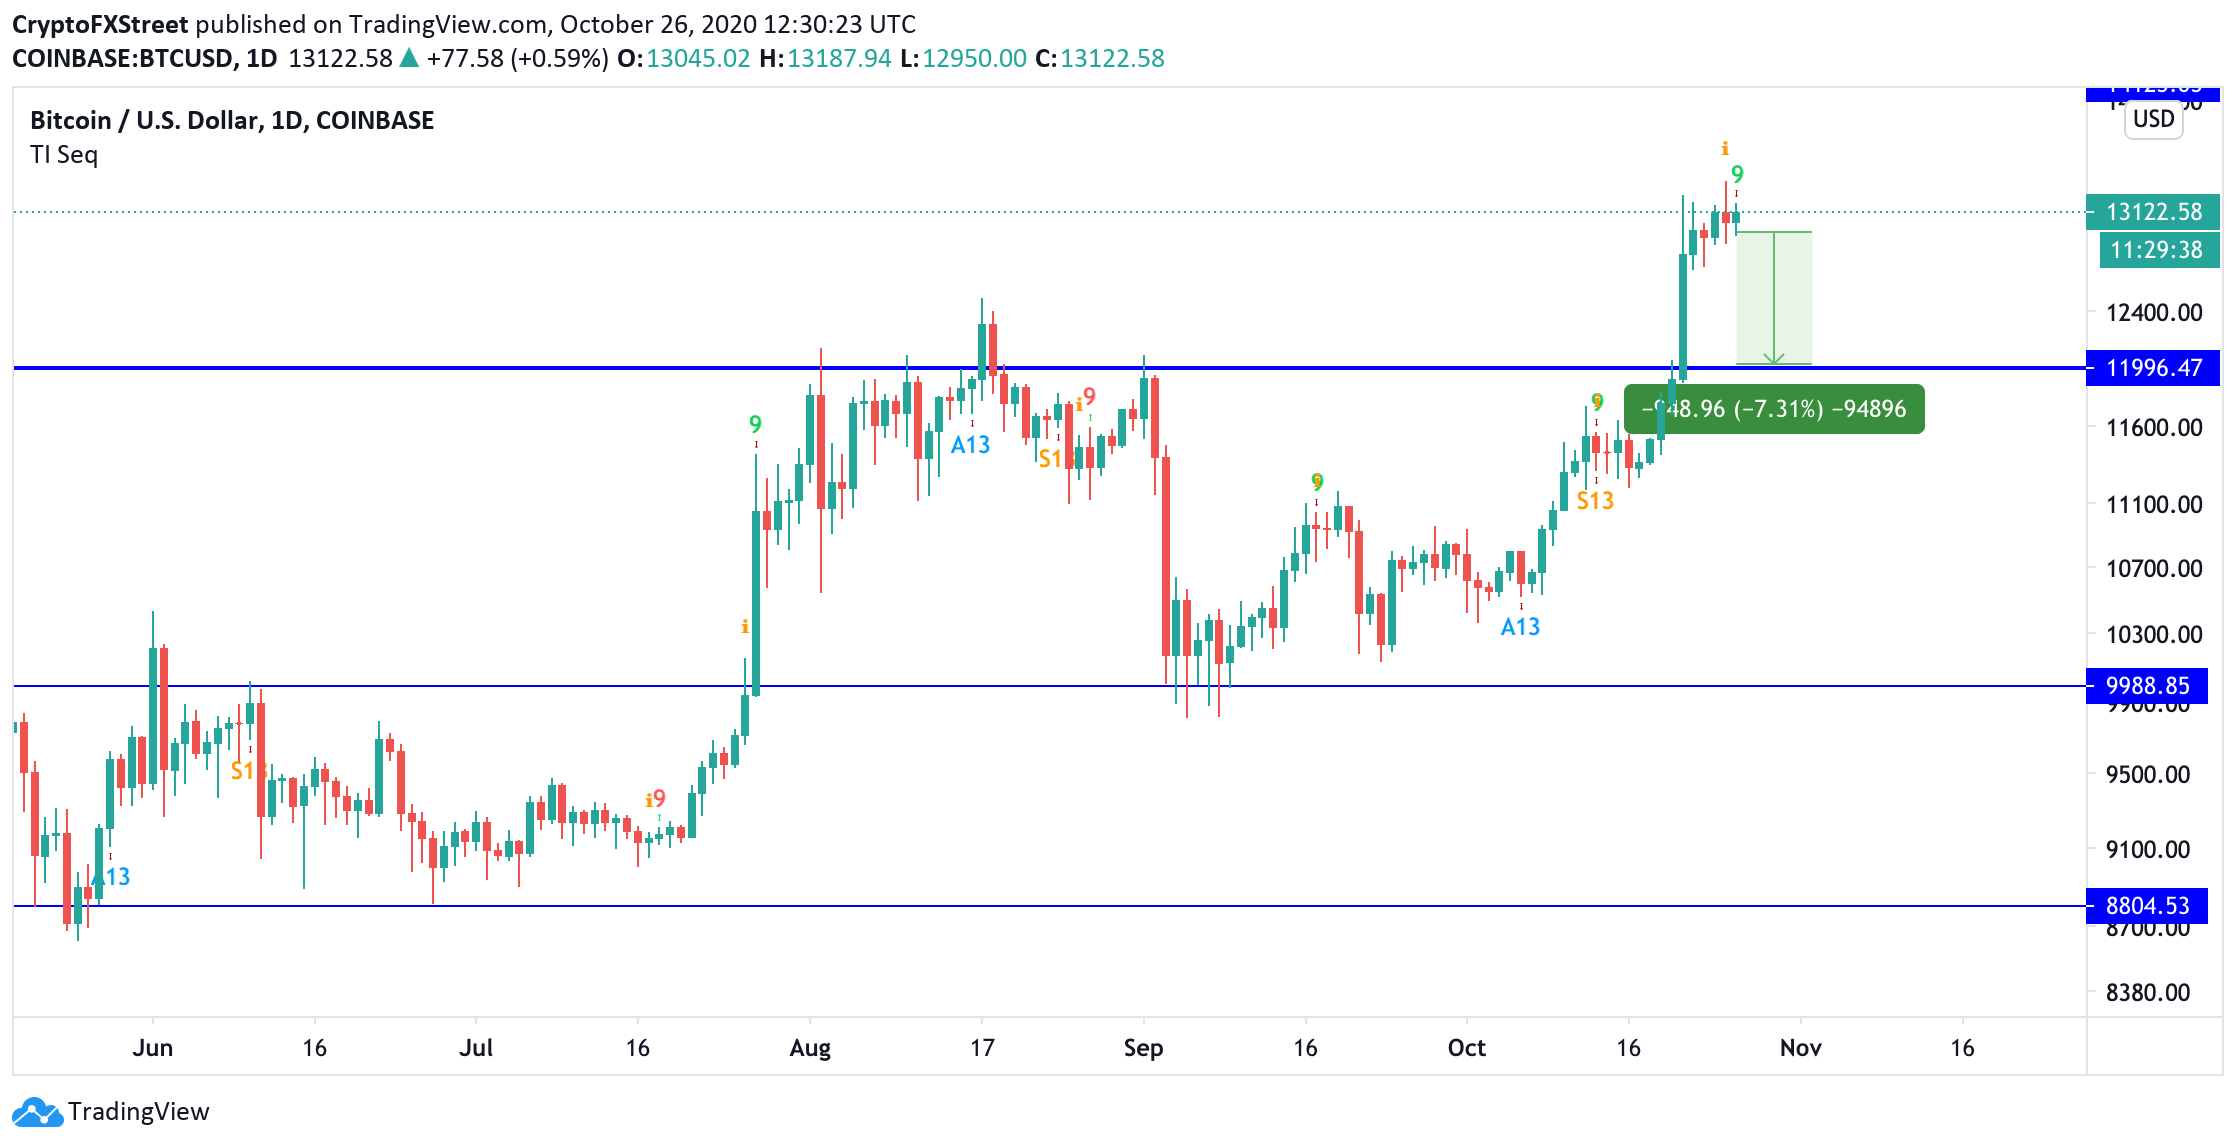
BTC/USD bears are ready to strike back

The TD Sequential indicator presented a sell signal on the daily chart in the form of a green nine candlestick. This bearish formation implies that the upcoming selling pressure may push it for one to four daily candlesticks with the first aim at $12,000. However, considering the strong long-term fundamentals, BTC may resume the recovery after a short-lived correction.

BTC/USD daily chart

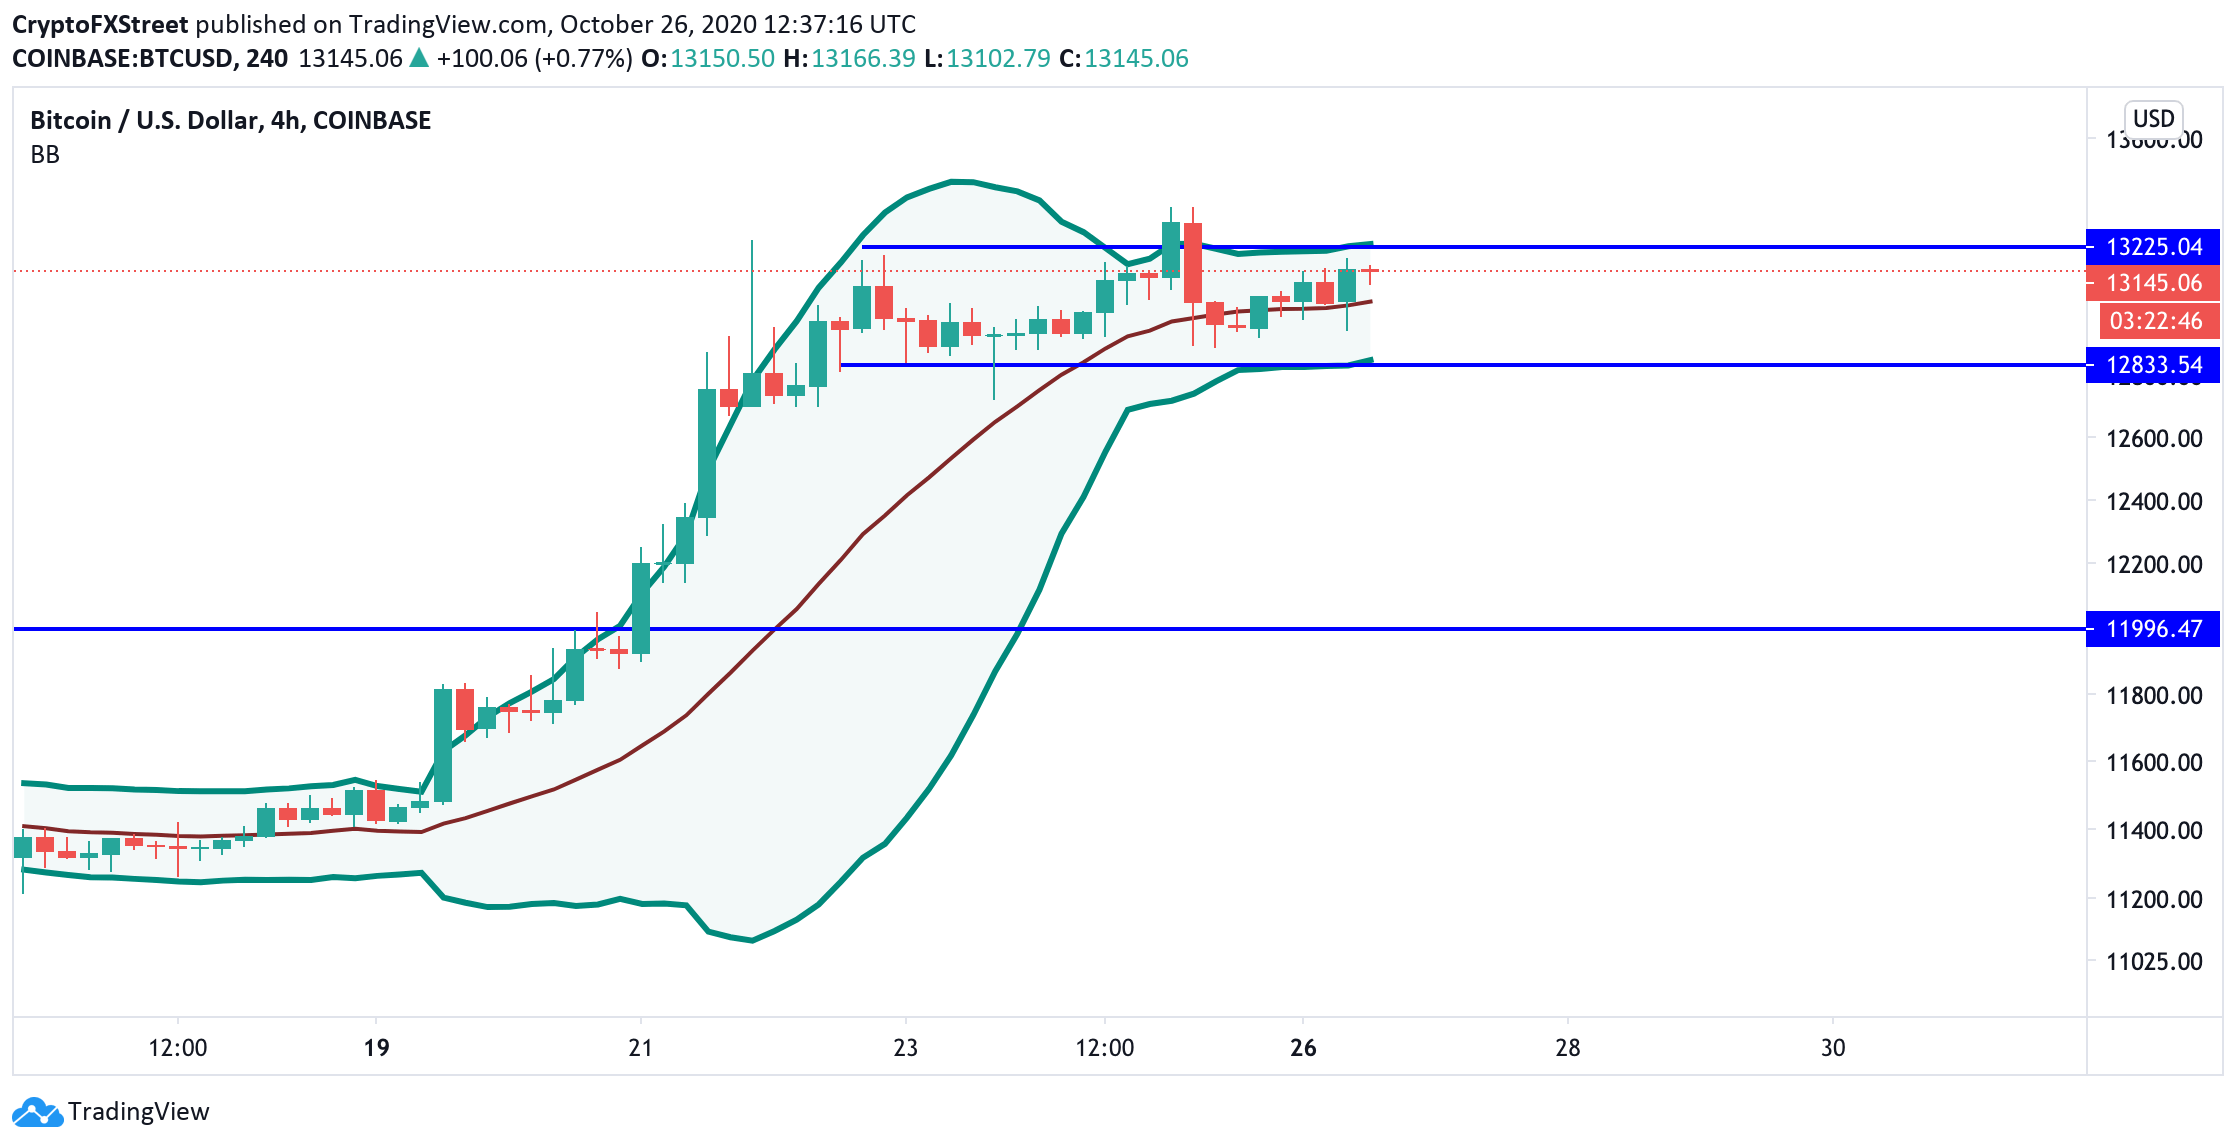
On the four-hour chart, BTC/USD is moving within the narrowing Bollinger Bands. A prolonged period of low trading activity implies that high volatility is underway as the squeeze of the Bollinger Bands and a stagnation period is usually considered as a precursor of large price movements.

A sustainable move below the lower band at $12,800 could signal a drop to $12,400 or $12,000. On the bullish side, in order to confirm the next upside wave, Bitcoin needs to break out above the upper band at $13,250, which coincides with the signal a jump to $15,000. 

BTC/USD 4-hour chart

The In/Out of the Money Positioning (IOMAP) confirms that there is strong support between the current price and $12,750 as over 1 million addresses holding over 800k coins. The next big cluster of addresses is registered on approach to $12,000, which is in line with the technical picture.

Bitcoin's IOMP data

Source: Intotheblock

Meanwhile, the market positioning data reveals that there are no significant barriers above the current price, meaning that the upside remains the path of least resistance now. 

BTC/USD: Key levels to watch

Considering the signals of the TD Sequential indicator and the on-chain data, Bitcoin may be ripe for a short-term downside correction with the ultimate bearish target at $12,800. This level will serve as a jumping-off ground and allow for a new bullish wave to take the price to $15,000. 

A move below $12,800 will bring more sellers to the market, with the potential downside aims $12,000 where a new buying interest is likely to appear.


Note: All information on this page is subject to change. The use of this website constitutes acceptance of our user agreement. Please read our privacy policy and legal disclaimer. Opinions expressed at FXstreet.com are those of the individual authors and do not necessarily represent the opinion of FXstreet.com or its management. Risk Disclosure: Trading foreign exchange on margin carries a high level of risk, and may not be suitable for all investors. The high degree of leverage can work against you as well as for you. Before deciding to invest in foreign exchange you should carefully consider your investment objectives, level of experience, and risk appetite. The possibility exists that you could sustain a loss of some or all of your initial investment and therefore you should not invest money that you cannot afford to lose. You should be aware of all the risks associated with foreign exchange trading, and seek advice from an independent financial advisor if you have any doubts.

Join Telegram

Recommended content


Recommended Content

Editors’ Picks

Celebrity meme coins controversy continues amid Pump.fun revenue dominance

Celebrity meme coins controversy continues amid Pump.fun revenue dominance

Pump.fun outperformed the Ethereum blockchain on Tuesday after raking in $1.99 million. Following this achievement, a meme coin based on actress Sydney Sweeney was the subject of controversy after its developers dumped their bags on investors.

More Meme Coins News

PEPE's on-chain metrics indicate potential rally after weeks of silence

PEPE's on-chain metrics indicate potential rally after weeks of silence

PEPE has struggled to see any significant price move after reaching an all-time high in May. Increased adoption rate and low MVRV ratio indicate a bullish run may be on the horizon. A single PEPE outflow from Binance worth $14.7 million gives credence to signs of bullish expectation.

More Pepe News

Ethereum has failed to overcome key resistance despite bullish sentiment surrounding ETH ETF

Ethereum has failed to overcome key resistance despite bullish sentiment surrounding ETH ETF

Ethereum (ETH) is down more than 1.4% on Tuesday following another ETH sale from the Ethereum Foundation. Meanwhile, crypto exchange Gemini's recent report reveals that ETH ETF could see about $5 billion in net inflows within six months of launch.

More Ethereum News

Crypto community blasts Polkadot following report of treasury spending

Crypto community blasts Polkadot following report of treasury spending

Polkadot reports $87 million of treasury spending during H1. Crypto community members expressed harsh feelings toward the DOT team's high spending. DOT is up more than 2% in the past 24 hours but risks correction following the report.

More Polkadot News

Bitcoin: BTC price correction could end in July, according to seasonal data

Bitcoin: BTC price correction could end in July, according to seasonal data

Bitcoin (BTC) price appears poised for a decline this week, influenced by slight outflows in US spot ETFs, selling activity among BTC miners, and a combined transfer of 4,690.28 BTC to centralized exchanges by the US and German governments.

Read full analysis

BTC

ETH

XRP