Bitcoin Price Analysis: BTC bulls battle key short-term resistances above $34,000


  • BTC/USD extends Wednesday’s recovery moves amid bullish MACD, strong RSI.
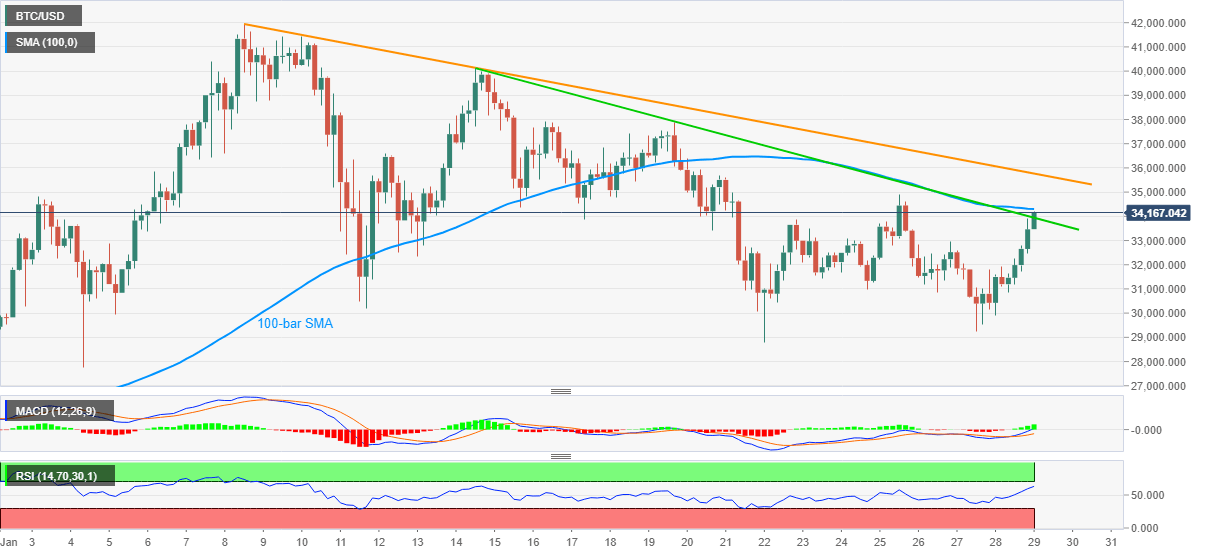
  • 100-bar SMA, descending trend line from January 08 adds to the upside barrier.
  • Multiple supports below $30,000 can test the bears.

BTC/USD rises to $34,167 while flashing a two-day winning streak during early Friday. The crypto major has been on a recovery move after taking a U-turn from $29,239 on Friday and is currently attacking a short-term resistance line and 100-bar SMA, from January 14.

With the upbeat RSI conditions joining the bullish MACD, BTC/USD is up for crossing the nearby hurdle around mid-$33,900. However, a clear break of 100-bar SMA, at $34,300 now, becomes necessary to convince the buyers. Also acting as the key upside barrier is a three-week-long descending trend line, at $35,770 now.

If at all the BTC/USD bulls cross $35,770, the $40,000 and the record top around $42,000, marked during the early January, should gain the market’s attention.

On the downside, Tuesday’s top near $32,900 can offer immediate support ahead of directing the quote down towards the weekly bottom of $29,239. Though, the $30,000 threshold can act as a buffer during the fall.

In a case where the BTC/USD prices keep declining below $29,239, January 22 low near $28,770 and the monthly bottom close to $27,780-75 can test bears.

Overall, BTC/USD is likely to regain its strength if it manages to cross the near-term key resistances.

BTC/USD four-hour chart

Trend: Further upside expected

BTC/USD

Overview
Today last price 33461.73
Today Daily Change 0.00
Today Daily Change % 0.00
Today daily open 33461.73
 
Trends
Daily SMA20 34899.99
Daily SMA50 29733.74
Daily SMA100 23034.51
Daily SMA200 16968.49
 
Levels
Previous Daily High 33906.51
Previous Daily Low 29914.15
Previous Weekly High 37860.2
Previous Weekly Low 28768.76
Previous Monthly High 29307.4
Previous Monthly Low 17578.63
Daily Fibonacci 38.2% 32381.43
Daily Fibonacci 61.8% 31439.23
Daily Pivot Point S1 30948.42
Daily Pivot Point S2 28435.11
Daily Pivot Point S3 26956.06
Daily Pivot Point R1 34940.78
Daily Pivot Point R2 36419.82
Daily Pivot Point R3 38933.14


Information on these pages contains forward-looking statements that involve risks and uncertainties. Markets and instruments profiled on this page are for informational purposes only and should not in any way come across as a recommendation to buy or sell in these assets. You should do your own thorough research before making any investment decisions. FXStreet does not in any way guarantee that this information is free from mistakes, errors, or material misstatements. It also does not guarantee that this information is of a timely nature. Investing in Open Markets involves a great deal of risk, including the loss of all or a portion of your investment, as well as emotional distress. All risks, losses and costs associated with investing, including total loss of principal, are your responsibility. The views and opinions expressed in this article are those of the authors and do not necessarily reflect the official policy or position of FXStreet nor its advertisers. The author will not be held responsible for information that is found at the end of links posted on this page.

If not otherwise explicitly mentioned in the body of the article, at the time of writing, the author has no position in any stock mentioned in this article and no business relationship with any company mentioned. The author has not received compensation for writing this article, other than from FXStreet.

FXStreet and the author do not provide personalized recommendations. The author makes no representations as to the accuracy, completeness, or suitability of this information. FXStreet and the author will not be liable for any errors, omissions or any losses, injuries or damages arising from this information and its display or use. Errors and omissions excepted.

The author and FXStreet are not registered investment advisors and nothing in this article is intended to be investment advice.

Recommended content


Recommended Content

Editors’ Picks

This week could be explosive for ETH: Ethereum ETFs to debut in the US on Tuesday

This week could be explosive for ETH: Ethereum ETFs to debut in the US on Tuesday

Ethereum (ETH) is down nearly 1% on Monday as the Securities & Exchange Commission (SEC) confirmed via its website on Tuesday that it has given the final approval for spot ETH ETFs. Considering the ETH ETF launch and the upcoming Bitcoin Conference, this week could prove crucial for Ethereum.

More Ethereum News

SEC gives final approval for Ethereum ETFs to begin trading

SEC gives final approval for Ethereum ETFs to begin trading

The Securities and Exchange Commission (SEC) approved the S-1 registration statements of spot Ethereum ETF issuers on Monday, making it the second digital asset ETF to go live in the US, according to the latest filings on its website. The approval is also visible across the websites of the various asset managers that applied for the product.

More Ethereum News

Could Donald Trump and Elon Musk provide Bitcoin's bullish spark?

Could Donald Trump and Elon Musk provide Bitcoin's bullish spark?

Trump could use Justice Department's 200,000 BTC as headstart for potential Bitcoin reserve, says analyst. Elon Musk hints at potential Bitcoin endorsement after US dollar value destruction post and laser eyes profile picture. The bearish crowd has remained silent since Bitcoin's two-week rebound.

More Bitcoin News

Crypto investment products continue positive run after $1.35 billion net inflows

Crypto investment products continue positive run after $1.35 billion net inflows

CoinShares' weekly report shows that crypto investment products saw a third consecutive week of inflows. Bitcoin saw inflows of $1.27 billion, with short-bitcoin recording more outflows. Ethereum-based products outperformed Solana on year-to-date inflows.

More Cryptocurrencies News

Bitcoin: Will BTC continue its bullish momentum?

Bitcoin: Will BTC continue its bullish momentum?

Bitcoin (BTC) price increased by 5.5% this week until Friday after breaking above a descending trendline. Currently, it is trading slightly higher by 0.23% at $64,166.

Read full analysis

BTC

ETH

XRP