- No. 1 coin licks wounds, volatile but within range on Saturday.
- BTC sellers look for entry below the 6000 level.
- Doji candle on daily chart suggests buyers’ exhaustion.
Bitcoin (BTC/USD), the most favorite cryptocurrency, snaps a four-day recovery rally and drops back in the red zone this Saturday. The sellers regained control after the coin failed to extend the recovery above the 6380 barrier. Despite the renewed weakness, the price manages to hold above the 6000 level. On Friday, the first coin fell sharply to sub-5700 levels after having faced rejection just shy of the 7k mark.
At the time of writing, Bitcoin battles 6100, losing 1.50% on the day while down nearly 5.50% over the last 24 hours. Its market capitalization now stands at $111.74 billion or 65.13% of the total market value.
Technical Overview
BTC/USD 15-minutes chart
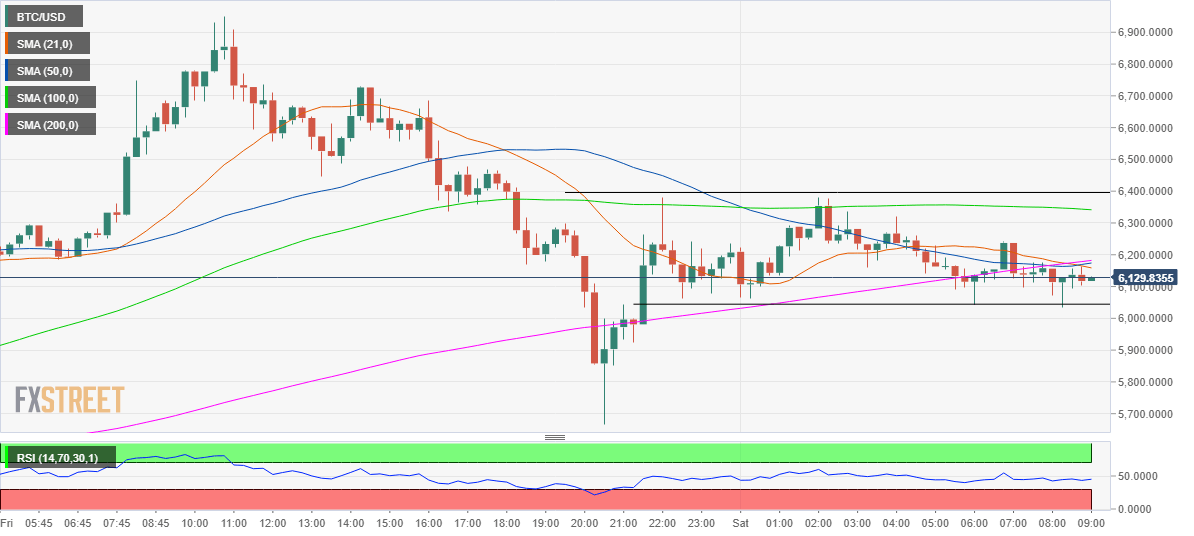
From a technical perspective, the coin remains trapped in a rectangle formation when tracked on the 15-minutes chart, as sellers await a fresh catalyst to resume the latest bearish momentum. The risks remain tilted to the downside, as the price continues to battle a stack of stiff resistances while it trades below all major Simple Moving Averages (SMA). Meanwhile, the Relative Strength Index (RSI) points south below the midline, as it heads towards the oversold conditions.
To the downside, there are no major support levels aligned once the spot breaches the 6000 psychological mark. Therefore, Friday’s low of 5666.65 will be eyed should the sellers extend control below the 6k level. Traders should sell any upside attempts to 6200 in the near-term, with the major SMAs likely to keep the recovery in check.
BTC/USD technical levels to watch
Information on these pages contains forward-looking statements that involve risks and uncertainties. Markets and instruments profiled on this page are for informational purposes only and should not in any way come across as a recommendation to buy or sell in these assets. You should do your own thorough research before making any investment decisions. FXStreet does not in any way guarantee that this information is free from mistakes, errors, or material misstatements. It also does not guarantee that this information is of a timely nature. Investing in Open Markets involves a great deal of risk, including the loss of all or a portion of your investment, as well as emotional distress. All risks, losses and costs associated with investing, including total loss of principal, are your responsibility. The views and opinions expressed in this article are those of the authors and do not necessarily reflect the official policy or position of FXStreet nor its advertisers. The author will not be held responsible for information that is found at the end of links posted on this page.
If not otherwise explicitly mentioned in the body of the article, at the time of writing, the author has no position in any stock mentioned in this article and no business relationship with any company mentioned. The author has not received compensation for writing this article, other than from FXStreet.
FXStreet and the author do not provide personalized recommendations. The author makes no representations as to the accuracy, completeness, or suitability of this information. FXStreet and the author will not be liable for any errors, omissions or any losses, injuries or damages arising from this information and its display or use. Errors and omissions excepted.
The author and FXStreet are not registered investment advisors and nothing in this article is intended to be investment advice.
Recommended Content
Editors’ Picks

Shiba Inu eyes positive returns in April as SHIB price inches towards $0.000015
Shiba Inu's on-chain metrics reveal robust adoption, as addresses with balances surge to 1.4 million. Shiba Inu's returns stand at a solid 14.4% so far in April, poised to snap a three-month bearish trend from earlier this year.

AI tokens TAO, FET, AI16Z surge despite NVIDIA excluding crypto-related projects from its Inception program
AI tokens, including Bittensor and Artificial Superintelligence Alliance, climbed this week, with ai16z still extending gains at the time of writing on Friday. The uptick in prices of AI tokens reflects a broader bullish sentiment across the cryptocurrency market.

Bitcoin Weekly Forecast: BTC consolidates after posting over 10% weekly surge
Bitcoin price is consolidating around $94,000 at the time of writing on Friday, holding onto the recent 10% increase seen earlier this week. This week’s rally was supported by strong institutional demand, as US spot ETFs recorded a total inflow of $2.68 billion until Thursday.

XRP price could renew 25% breakout bid on surging institutional and retail adoption
Ripple price consolidates, trading at $2.18 at the time of writing on Friday, following mid-week gains to $2.30. The rejection from this weekly high led to the price of XRP dropping to the previous day’s low at $2.11, followed by a minor reversal.
Bitcoin Weekly Forecast: BTC consolidates after posting over 10% weekly surge
Bitcoin (BTC) price is consolidating around $94,000 at the time of writing on Friday, holding onto the recent 10% increase seen earlier this week.

The Best brokers to trade EUR/USD
SPONSORED Discover the top brokers for trading EUR/USD in 2025. Our list features brokers with competitive spreads, fast execution, and powerful platforms. Whether you're a beginner or an expert, find the right partner to navigate the dynamic Forex market.