- Bitcoin consolidates Saturday’s brief spike to $9200.
- The No.1 coin looks to retest $9200 on the hourly chart.
- The downside appears more compelling on the daily sticks.
Bitcoin (BTC/USD) has entered a phase of consolidation after reversing sharply from the late-Saturday spike to $9195.19 highs. The spot was sold-off at the $9200 level amid thin liquidity on the US Independence Day. The choppy trend is likely to extend across the crypto space as traders are away due to the extended weekend break. Markets are awaiting a strong catalyst to revive the near-term bullish momentum on Sunday. Meanwhile, the No. 1 coin is poised to end the week with modest gains, currently defending the $9100 mark. It enjoys a market capitalization of $167.69 billion.
Technical Overview
BTC/USD: Hourly chart
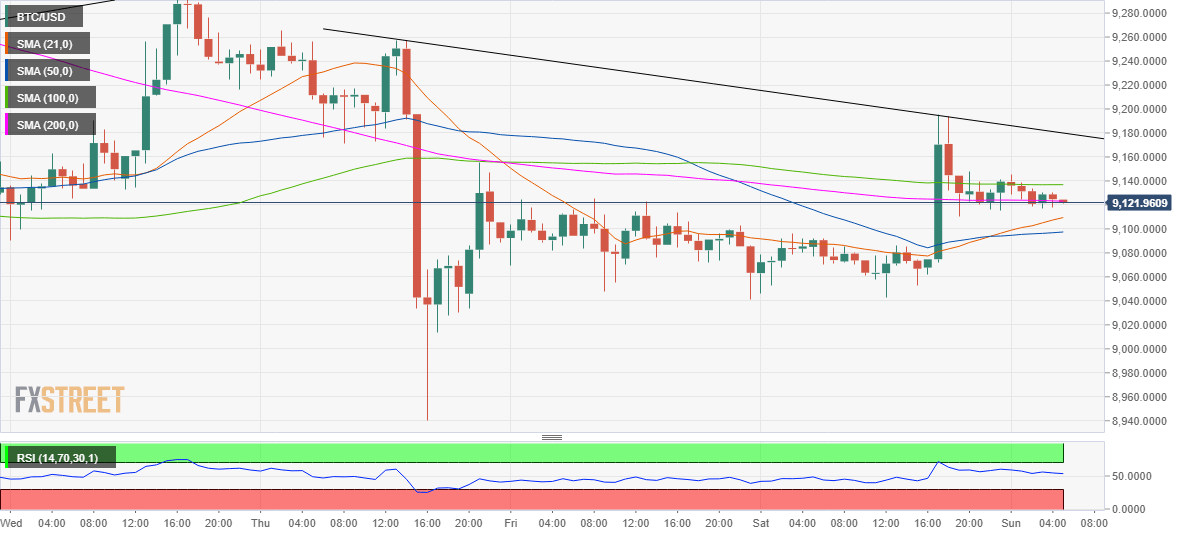
On the hourly chart, the price is back below the horizontal 100-hourly Simple Moving Average (HMA) at $9136.88 while clinging to 200-HMA at $9123.13 so far this Sunday. The hourly Relative Strength Index (RSI) trades neutral but above the midline, suggesting there is still scope for a fresh leg higher.
Meanwhile, the 21-HMA at $9109 had crossed the 50-HMA from below in the overnight trades, which also backs the case for another test of the $9200 mark should the 100-HMA barrier give way once again.
Until a fresh volatility wave hits the crypto space once again, the No. 1 coin is likely to range between the 100-HMA and 21-HMA in the day ahead.
BTC/USD: Daily chart
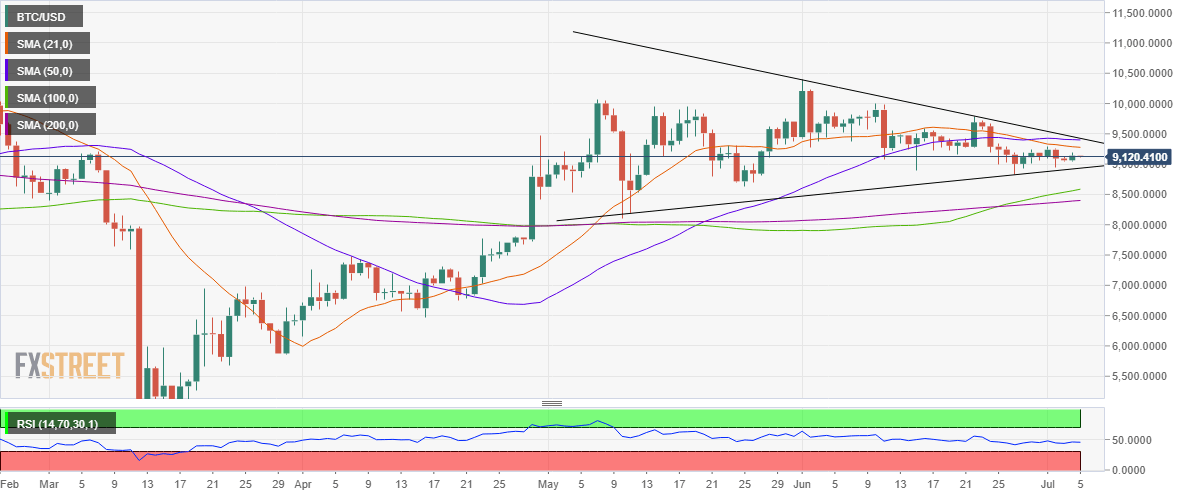
The price is trending in a potential symmetrical triangle pattern on the daily sticks since early May, forming lower highs over the past one month while the daily RSI continues to trade below the 50 level.
Further, the 21-daily Simple Moving Average (21-DMA) cut the 50-DMA from above last week, as the coin trades below the aforesaid DMAs.
Inferring from the above technical indicators, the path of least resistance appears to the downside in the coming weeks, given a lack of healthy support levels.
A breach of the rising trendline support at $8919.80 will confirm the pattern breakdown, opening floors for a test of the upward sloping 100-DMA at $8559. The next support awaits at the horizontal 200-DMA at $8390.97.
On the flip side, if the bulls succeed to take out the 21-DMA, the $9405/50 area will be a tough nut to crack. That supply zone is the confluence of the 100-DMA and the falling trendline resistance.
BTC/USD: Additional levels to watch
Information on these pages contains forward-looking statements that involve risks and uncertainties. Markets and instruments profiled on this page are for informational purposes only and should not in any way come across as a recommendation to buy or sell in these assets. You should do your own thorough research before making any investment decisions. FXStreet does not in any way guarantee that this information is free from mistakes, errors, or material misstatements. It also does not guarantee that this information is of a timely nature. Investing in Open Markets involves a great deal of risk, including the loss of all or a portion of your investment, as well as emotional distress. All risks, losses and costs associated with investing, including total loss of principal, are your responsibility. The views and opinions expressed in this article are those of the authors and do not necessarily reflect the official policy or position of FXStreet nor its advertisers. The author will not be held responsible for information that is found at the end of links posted on this page.
If not otherwise explicitly mentioned in the body of the article, at the time of writing, the author has no position in any stock mentioned in this article and no business relationship with any company mentioned. The author has not received compensation for writing this article, other than from FXStreet.
FXStreet and the author do not provide personalized recommendations. The author makes no representations as to the accuracy, completeness, or suitability of this information. FXStreet and the author will not be liable for any errors, omissions or any losses, injuries or damages arising from this information and its display or use. Errors and omissions excepted.
The author and FXStreet are not registered investment advisors and nothing in this article is intended to be investment advice.
Recommended Content
Editors’ Picks

Bitcoin, Ethereum and XRP steady as China slaps 125% tariff on US, weekend sell-off looming?
The Cryptocurrency market shows stability at the time of writing on Friday, with Bitcoin (BTC) holding steady at $82,584, Ethereum (ETH) at $1,569, and Ripple (XRP) maintaining its position above $2.00.

Bitcoin Weekly Forecast: Market uncertainty lingers, Trump’s 90-day tariff pause sparks modest recovery
Bitcoin price extends recovery to around $82,500 on Friday after dumping to a new year-to-date low of $74,508 to start the week. Market uncertainty remains high, leading to a massive shakeout, with total liquidations hitting $2.18 billion across crypto markets.

Bitcoin, Ethereum, Dogecoin and Cardano stabilze – Why crypto is in limbo
Bitcoin, Ethereum, Dogecoin and Cardano stabilize on Friday as crypto market capitalization steadies around $2.69 trillion. Crypto traders are recovering from the swing in token prices and the Monday bloodbath.

Can FTX’s 186,000 unstaked SOL dampen Solana price breakout hopes?
Solana price edges higher and trades at $117.31 at the time of writing on Friday, marking a 3.4% increase from the $112.80 open. The smart contracts token corrected lower the previous day, following a sharp recovery to $120 induced by US President Donald Trump’s 90-day tariff pause on Wednesday.
Bitcoin Weekly Forecast: Market uncertainty lingers, Trump’s 90-day tariff pause sparks modest recovery
Bitcoin (BTC) price extends recovery to around $82,500 on Friday after dumping to a new year-to-date low of $74,508 to start the week. Market uncertainty remains high, leading to a massive shakeout, with total liquidations hitting $2.18 billion across crypto markets.

The Best brokers to trade EUR/USD
SPONSORED Discover the top brokers for trading EUR/USD in 2025. Our list features brokers with competitive spreads, fast execution, and powerful platforms. Whether you're a beginner or an expert, find the right partner to navigate the dynamic Forex market.