Bitcoin prepares to flush out “weak hands” with a steep correction
- Bitcoin's technical indicators imply that a major downside correction is underway.
- On-chain metrics signal that the bears may be stopped on approach to $16,000.

Bitcoin bulls have been driving the market this week. In the past three days, Bitcoin's price increased by over $2000, building upon a robust month-long rally. Once the price broke through $12,500, the community already knew that the mega rally has started.
Bitcoin has a history of major corrections
Bitcoin hit bottom in the middle of March when the COVID-19 pandemic was spreading across the world like a wildfire. Since that time, the pioneer digital asset has regained the lost ground and set new multi-year highs. However, the cryptocurrency community should be aware of the potential danger ahead.
Bitcoin's bull runs are always accompanied by steep and often painful corrections that may discourage novice traders. For example, in 2013, Bitcoin tried to clear an all-time high of nearly $1,200 twice, and 30-40% corrections accompanied both attempts. Only the third recovery was strong enough to finally turn this milestone into support and ensure a massive BTC rally to new records.
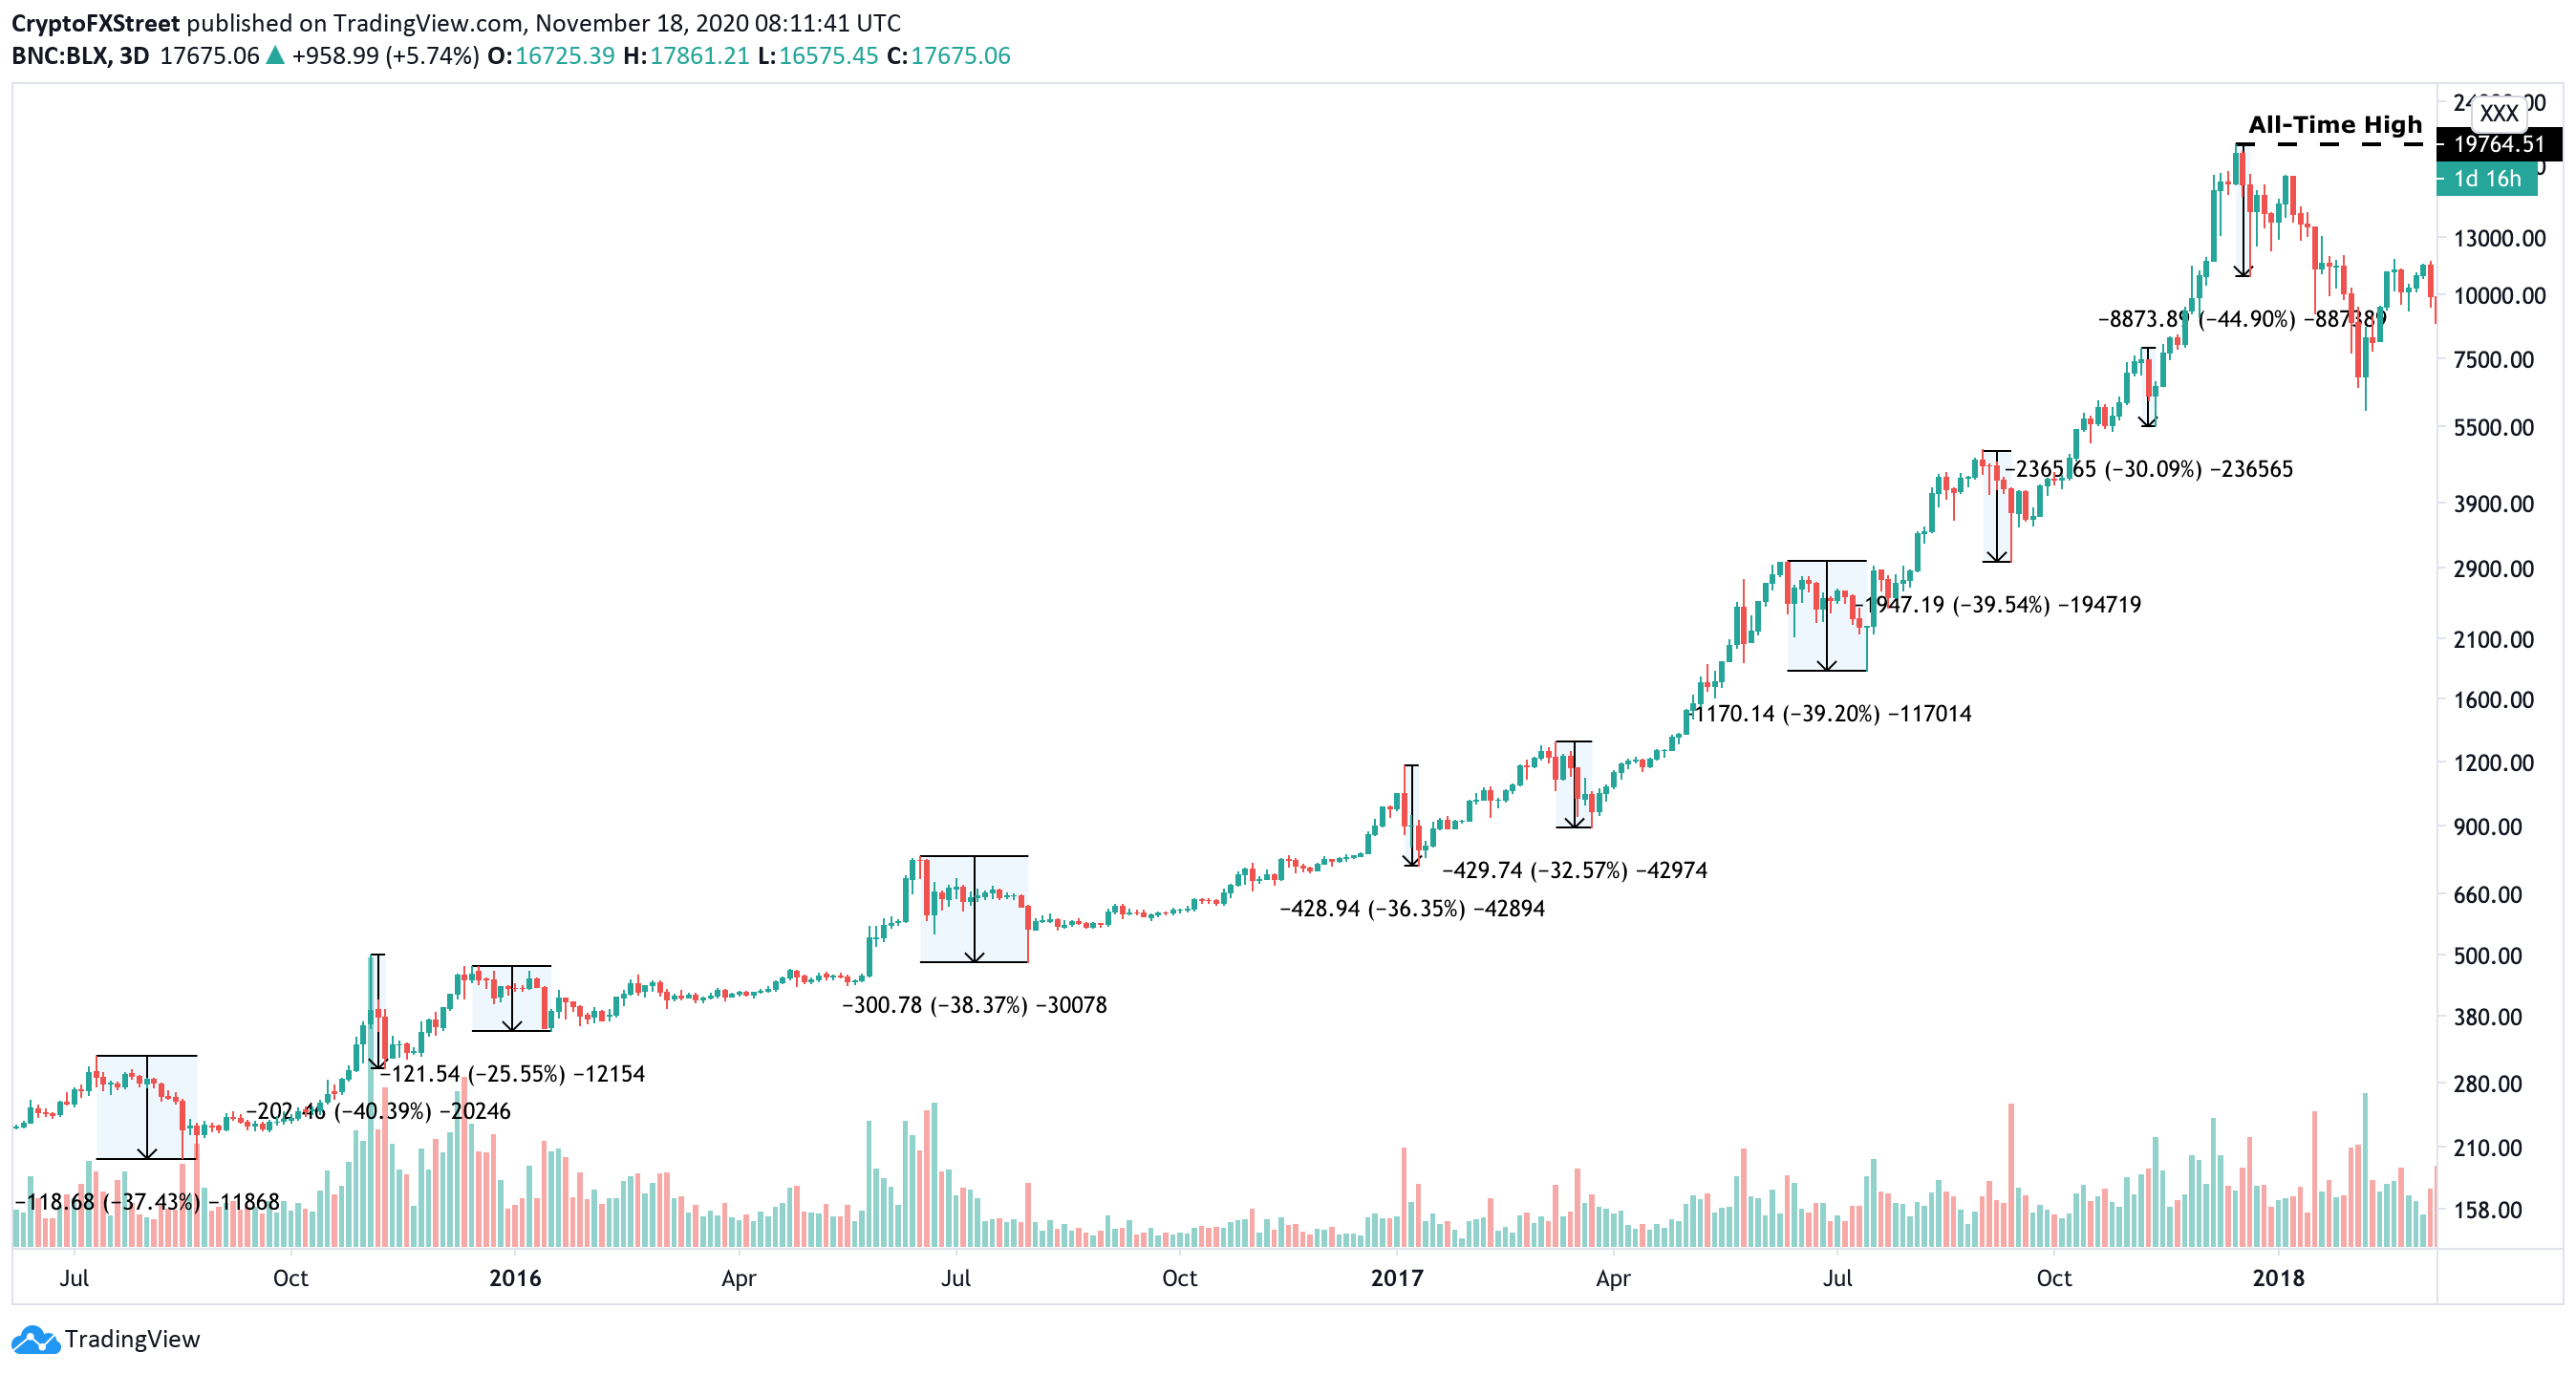
Bitcoin's history of corrections
If history is any guide, BTC traders should brace for a sharp retreat before a new all-time high is set. Moreover, the technical indicators are signaling that the correction is underway.
TD sequential indicator sends ominous signals across all time-frames
TD sequential indicator usually provides accurate and actionable information about the price direction. Each time a green nine candlestick appears on a chart, traders should be aware of a potential sell-off that may result in creating from one to four green candlesticks on a given time frame.
Now the indicator sends a sell signal in the form of eight green candlesticks on various time frames. It means that the price is ripe for the long-term downside correction that may start within the nearest 24 hours.
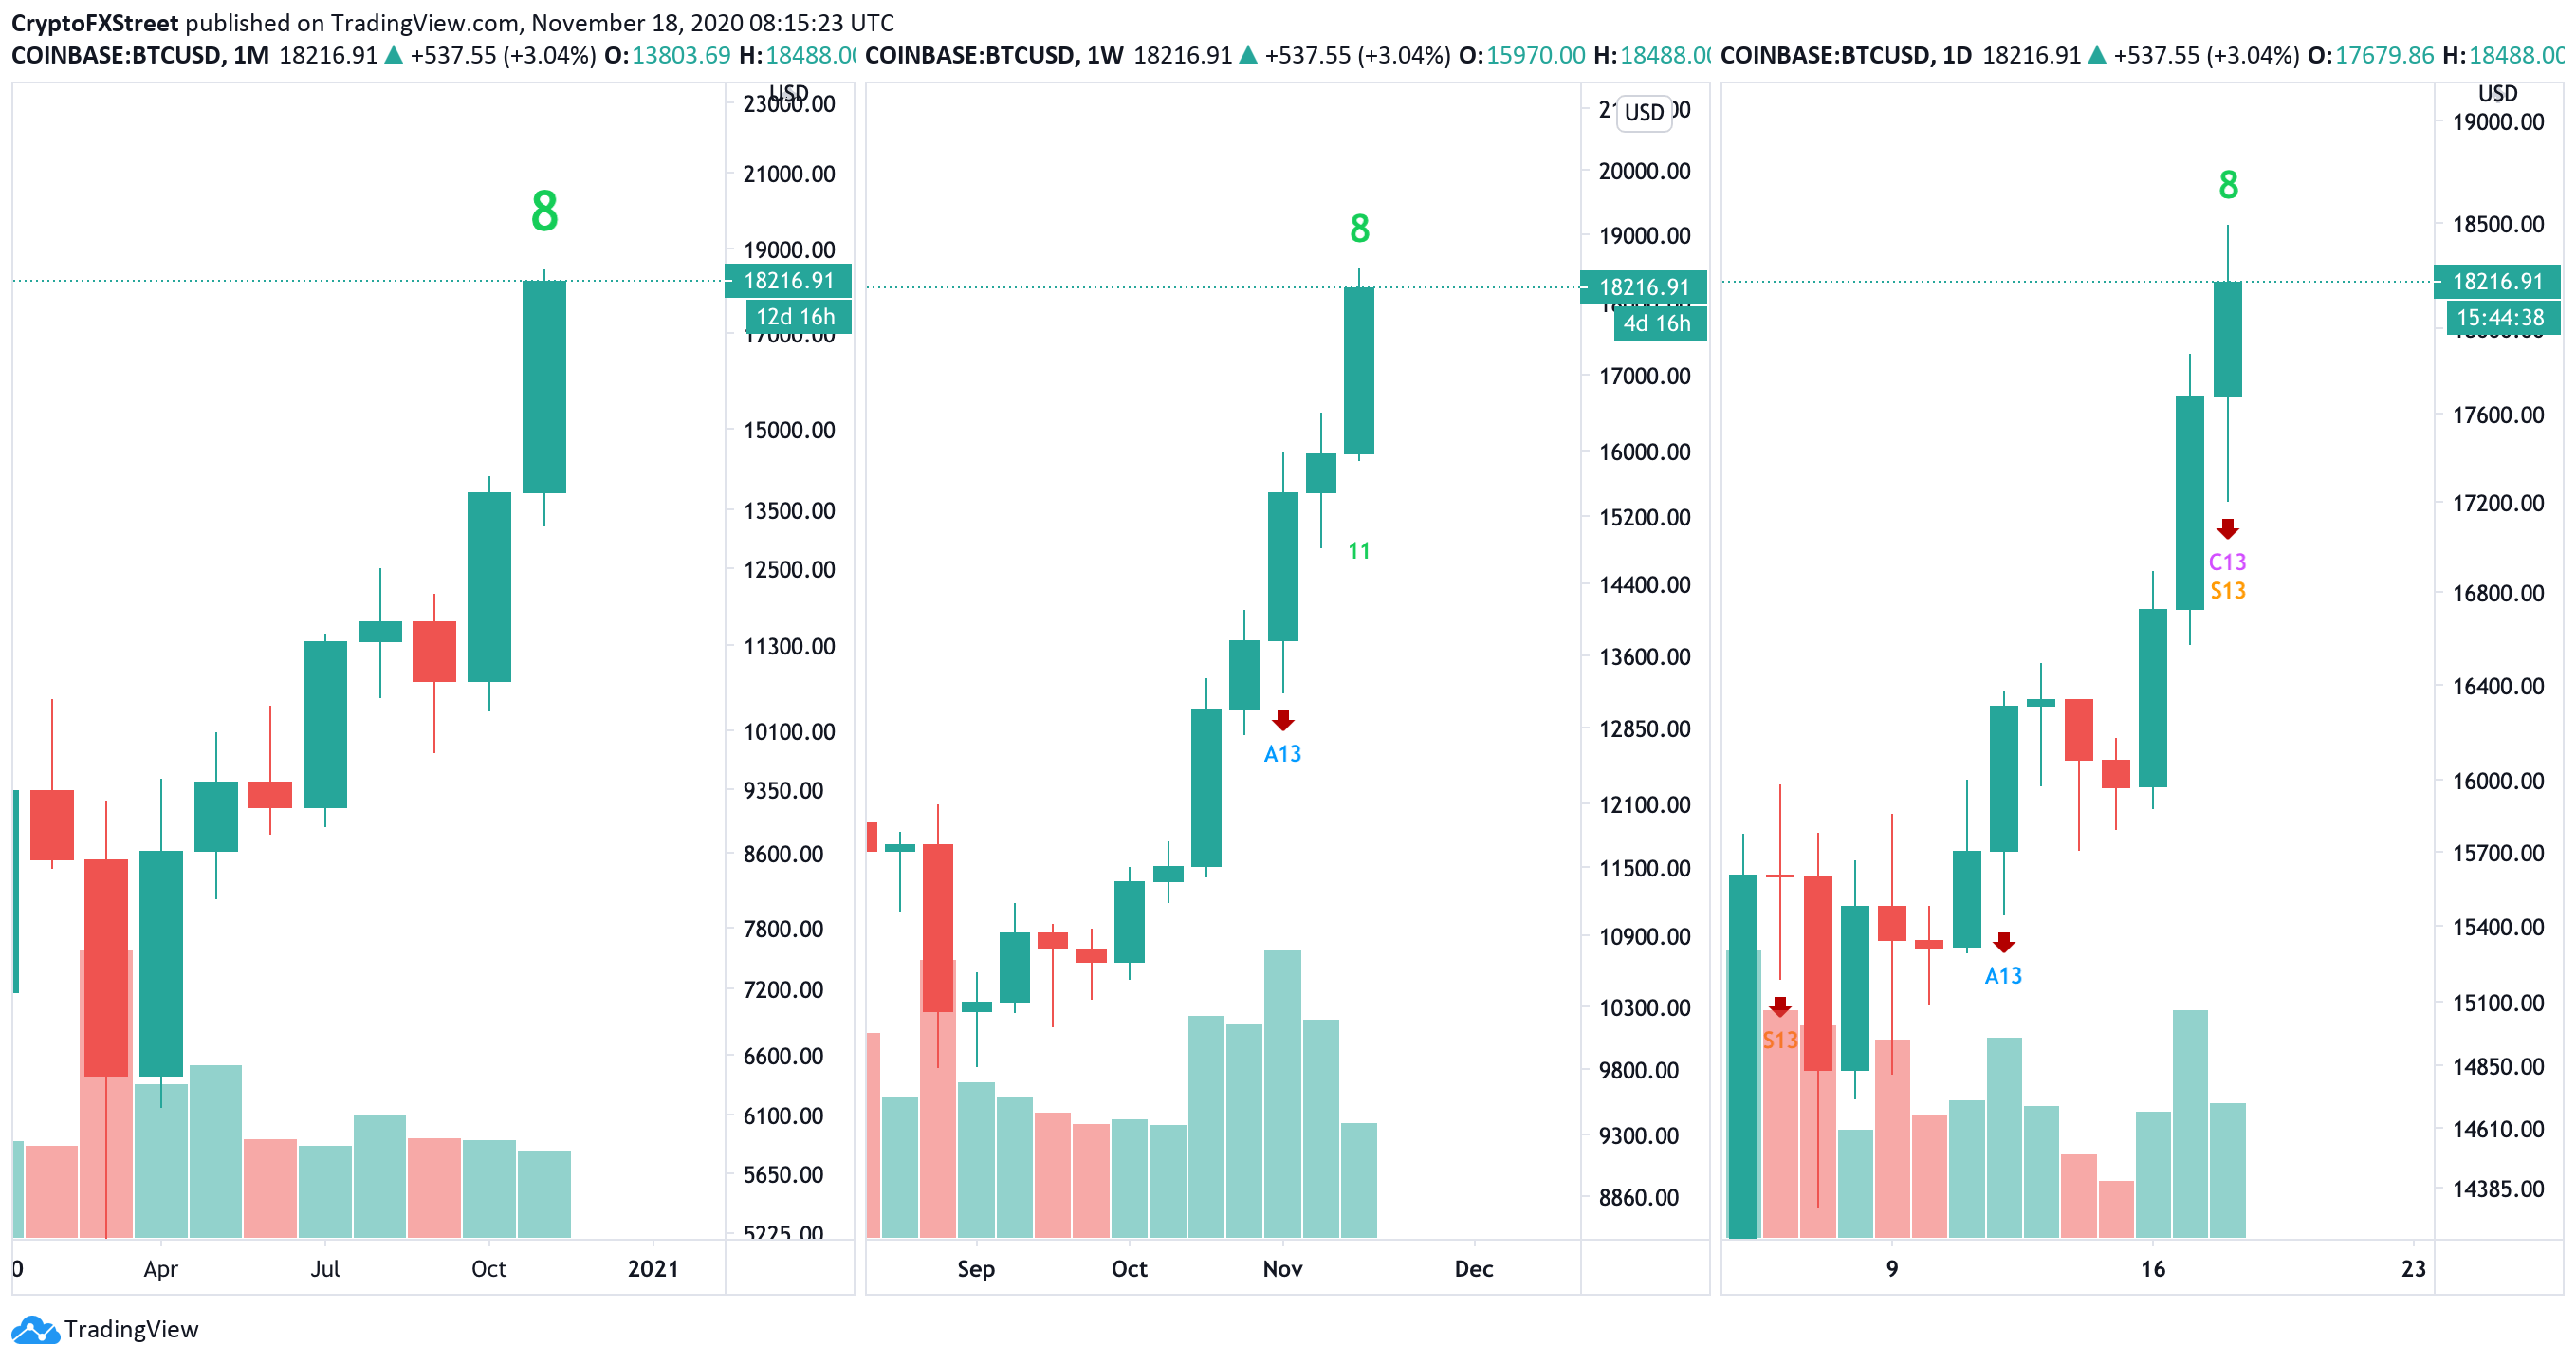
Bitcoin, multiple time frames
If BTC has created a top at the recent high of $18,500, and the price momentum is similar to what happened during the previous bull runs, that we can expect a significant retreat to the 38.2% Fibonacci retracement level at $12,900 before the uptrend resumes.
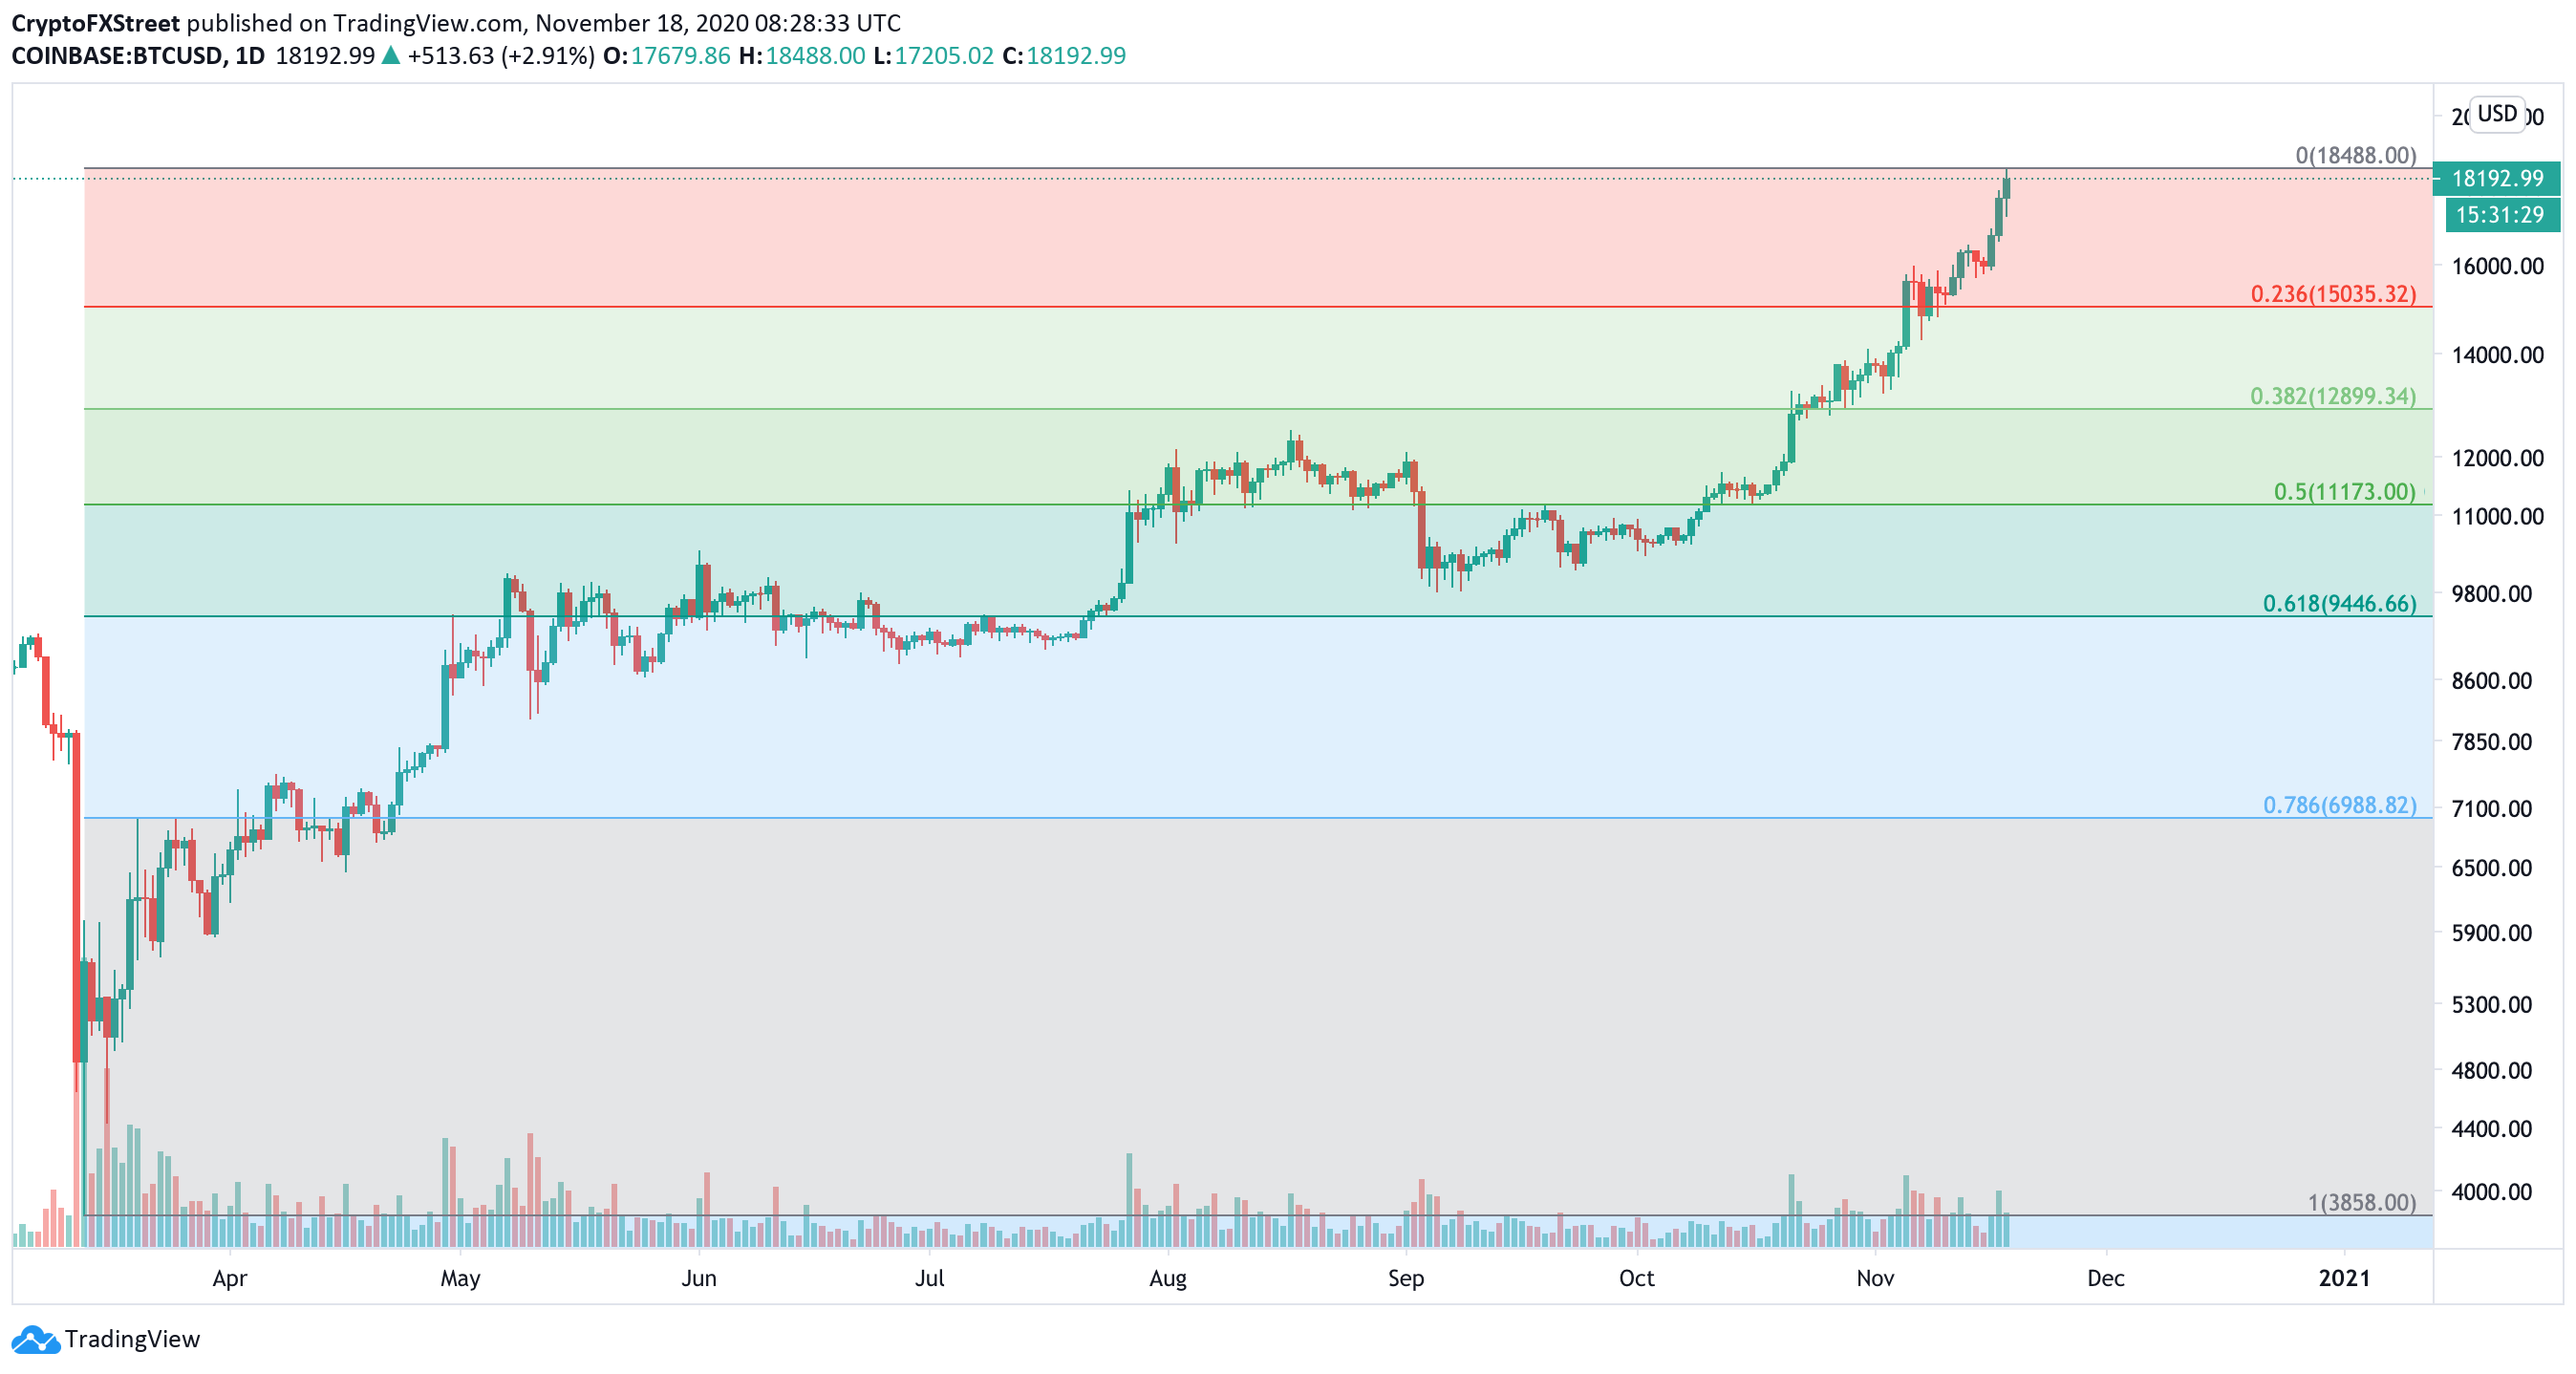
Bitcoin, daily chart
On-chain metrics are reassuring
Meanwhile, IntoTheBlock's "In/Out of the Money Around Price" model implies that BTC is sitting on top of firm support as nearly 500,000 addresses previously purchased over 200,000 BTC between $17,100 and $17,700. Notably, this supply wall is followed by another significant support on approach to $16,000.
 Analytics and Charts18-637412938006056332.png)
Bitcoin In/Out of the Money Around Price
On the other hand, the upside seems to be clear as there are no significant barriers located above the current price and up at least $19,300. If the support at $16,000 is rejected and buy orders continue to pile up, BTC may easily move towards $19,000 with little resistance on the way.
Author

Tanya Abrosimova
Independent Analyst


