Bitcoin (BTC) sellers returned during Asia hours given strong resistance near the $40,000 level. The cryptocurrency was trading around $38,000 at press time and is down 5% over the past week. Initial support is seen around $34,000 and $36,000, which could stabilize the pullback.
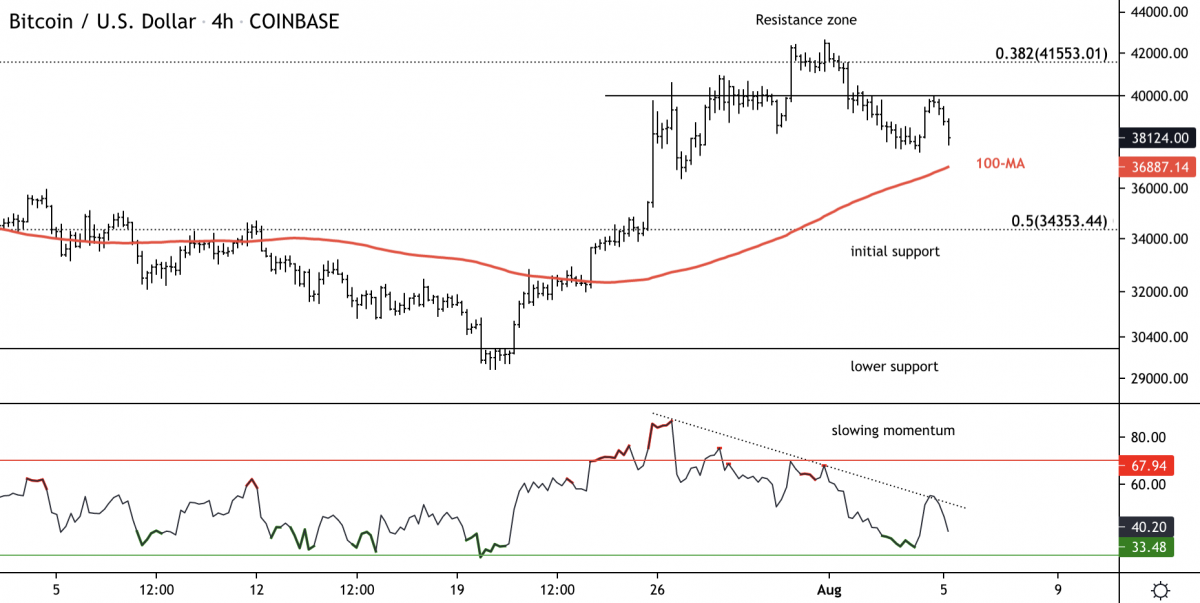
Bitcoin four-hour price chart shows short-term support and resistance levels with RSI.
Source: TradingView
-
The relative strength index (RSI) on the four-hour chart made a series of lower highs as upside momentum slowed. Short-term buyers responded to oversold conditions on Wednesday but failed to push past $40,000 resistance.
-
Initial support is seen at $36,000, which is near the 100-period moving average on the four-hour chart. Buyers will likely defend support above $30,000 as bitcoin (BTC, -3.31%) remains in a consolidation phase.
-
Bitcoin’s intermediate-term downtrend remains in effect despite the near 30% short-squeeze rally over the past two weeks.
All writers’ opinions are their own and do not constitute financial advice in any way whatsoever. Nothing published by CoinDesk constitutes an investment recommendation, nor should any data or Content published by CoinDesk be relied upon for any investment activities. CoinDesk strongly recommends that you perform your own independent research and/or speak with a qualified investment professional before making any financial decisions.
Recommended Content
Editors’ Picks
Celebrity meme coins controversy continues amid Pump.fun revenue dominance
![Celebrity meme coins controversy continues amid Pump.fun revenue dominance](https://editorial.fxstreet.com/images/Resources/CryptoWorldSEO3_XtraSmall.jpg)
Pump.fun outperformed the Ethereum blockchain on Tuesday after raking in $1.99 million. Following this achievement, a meme coin based on actress Sydney Sweeney was the subject of controversy after its developers dumped their bags on investors.
PEPE's on-chain metrics indicate potential rally after weeks of silence
![PEPE's on-chain metrics indicate potential rally after weeks of silence](https://editorial.fxstreet.com/images/Markets/Currencies/Cryptocurrencies/PEPE/PEPE_coin_XtraSmall.jpg)
PEPE has struggled to see any significant price move after reaching an all-time high in May. Increased adoption rate and low MVRV ratio indicate a bullish run may be on the horizon. A single PEPE outflow from Binance worth $14.7 million gives credence to signs of bullish expectation.
Ethereum has failed to overcome key resistance despite bullish sentiment surrounding ETH ETF
![Ethereum has failed to overcome key resistance despite bullish sentiment surrounding ETH ETF](https://editorial.fxstreet.com/images/Markets/Currencies/Digital%20Currencies/Ethereum/ethereum_2_XtraSmall.jpg)
Ethereum (ETH) is down more than 1.4% on Tuesday following another ETH sale from the Ethereum Foundation. Meanwhile, crypto exchange Gemini's recent report reveals that ETH ETF could see about $5 billion in net inflows within six months of launch.
Crypto community blasts Polkadot following report of treasury spending
![Crypto community blasts Polkadot following report of treasury spending](https://editorial.fxstreet.com/images/Markets/Currencies/Cryptocurrencies/Polkadot/polkadot-150x150logo-637399979978734311_XtraSmall.png)
Polkadot reports $87 million of treasury spending during H1. Crypto community members expressed harsh feelings toward the DOT team's high spending. DOT is up more than 2% in the past 24 hours but risks correction following the report.
Bitcoin: BTC price correction could end in July, according to seasonal data
![Bitcoin: BTC price correction could end in July, according to seasonal data](https://editorial.fxstreet.com/images/Markets/Currencies/Digital%20Currencies/Bitcoin/bitcoin_5_XtraSmall.jpg)
Bitcoin (BTC) price appears poised for a decline this week, influenced by slight outflows in US spot ETFs, selling activity among BTC miners, and a combined transfer of 4,690.28 BTC to centralized exchanges by the US and German governments.