Bitcoin options traders appear bearish and lack confidence in placing directional bets
- Bitcoin options traders are as bearish as they were during the May 2021 crash.
- The implied volatility also suggests that options investors have no idea where BTC could be headed next.
- Bitcoin options are now cheaper than it has been in a very long time.

Bitcoin options data suggest that traders are currently bearish and hesitant in betting on the leading cryptocurrency’s next directional moves. Investors have not been this long-term bearish since the May 2021 crash when over 50% of BTC value was wiped out.
Bitcoin options traders are hesitant
Cryptocurrency market analysis firm Arcane Research recently released a new report, noting that the low implied volatility at roughly 70% indicates that options traders have not been more long-term bearish since May 2021.
Since Bitcoin options allow traders to bet on movements in BTC price, the more volatile the asset is, the more expensive its options are. Therefore, the low implied volatility rate indicates that traders may be hesitant to bet on where the bellwether cryptocurrency could go next, and options are cheaper than it has been in a long time.
Arcane Research further noted that Bitcoin’s volatility skew has been the highest since May 2021. Volatility skew measures the relative difference between prices of put and call options.
Historically, call options have been more expensive than put options, generating a negative volatility skew.
However, following the recent decline in Bitcoin price, the BTC volatility skew is now the highest since the May 2021 crash, suggesting that there is more demand for puts than calls, a bearish sign.
Bitcoin options traders are now more bearish than they have been in a long time, and they also seem hesitant on picking a direction that they think BTC is headed in.
The report suggests that this may be an opportunity “to buy some cheap calls.”
Bitcoin price forms bullish chart pattern
Despite the lack of confidence shown by Bitcoin options traders, BTC has formed an ascending triangle pattern on the 4-hour chart, projecting a 15% climb from its upper boundary toward $44,884.
In order for the leading cryptocurrency to reach the bullish target, Bitcoin must slice above the upper boundary of the prevailing chart pattern at $38,982. Additional obstacles may emerge at the 200 four-hour Simple Moving Average (SMA) at $41,225, then at the 50% retracement level at $43,016.
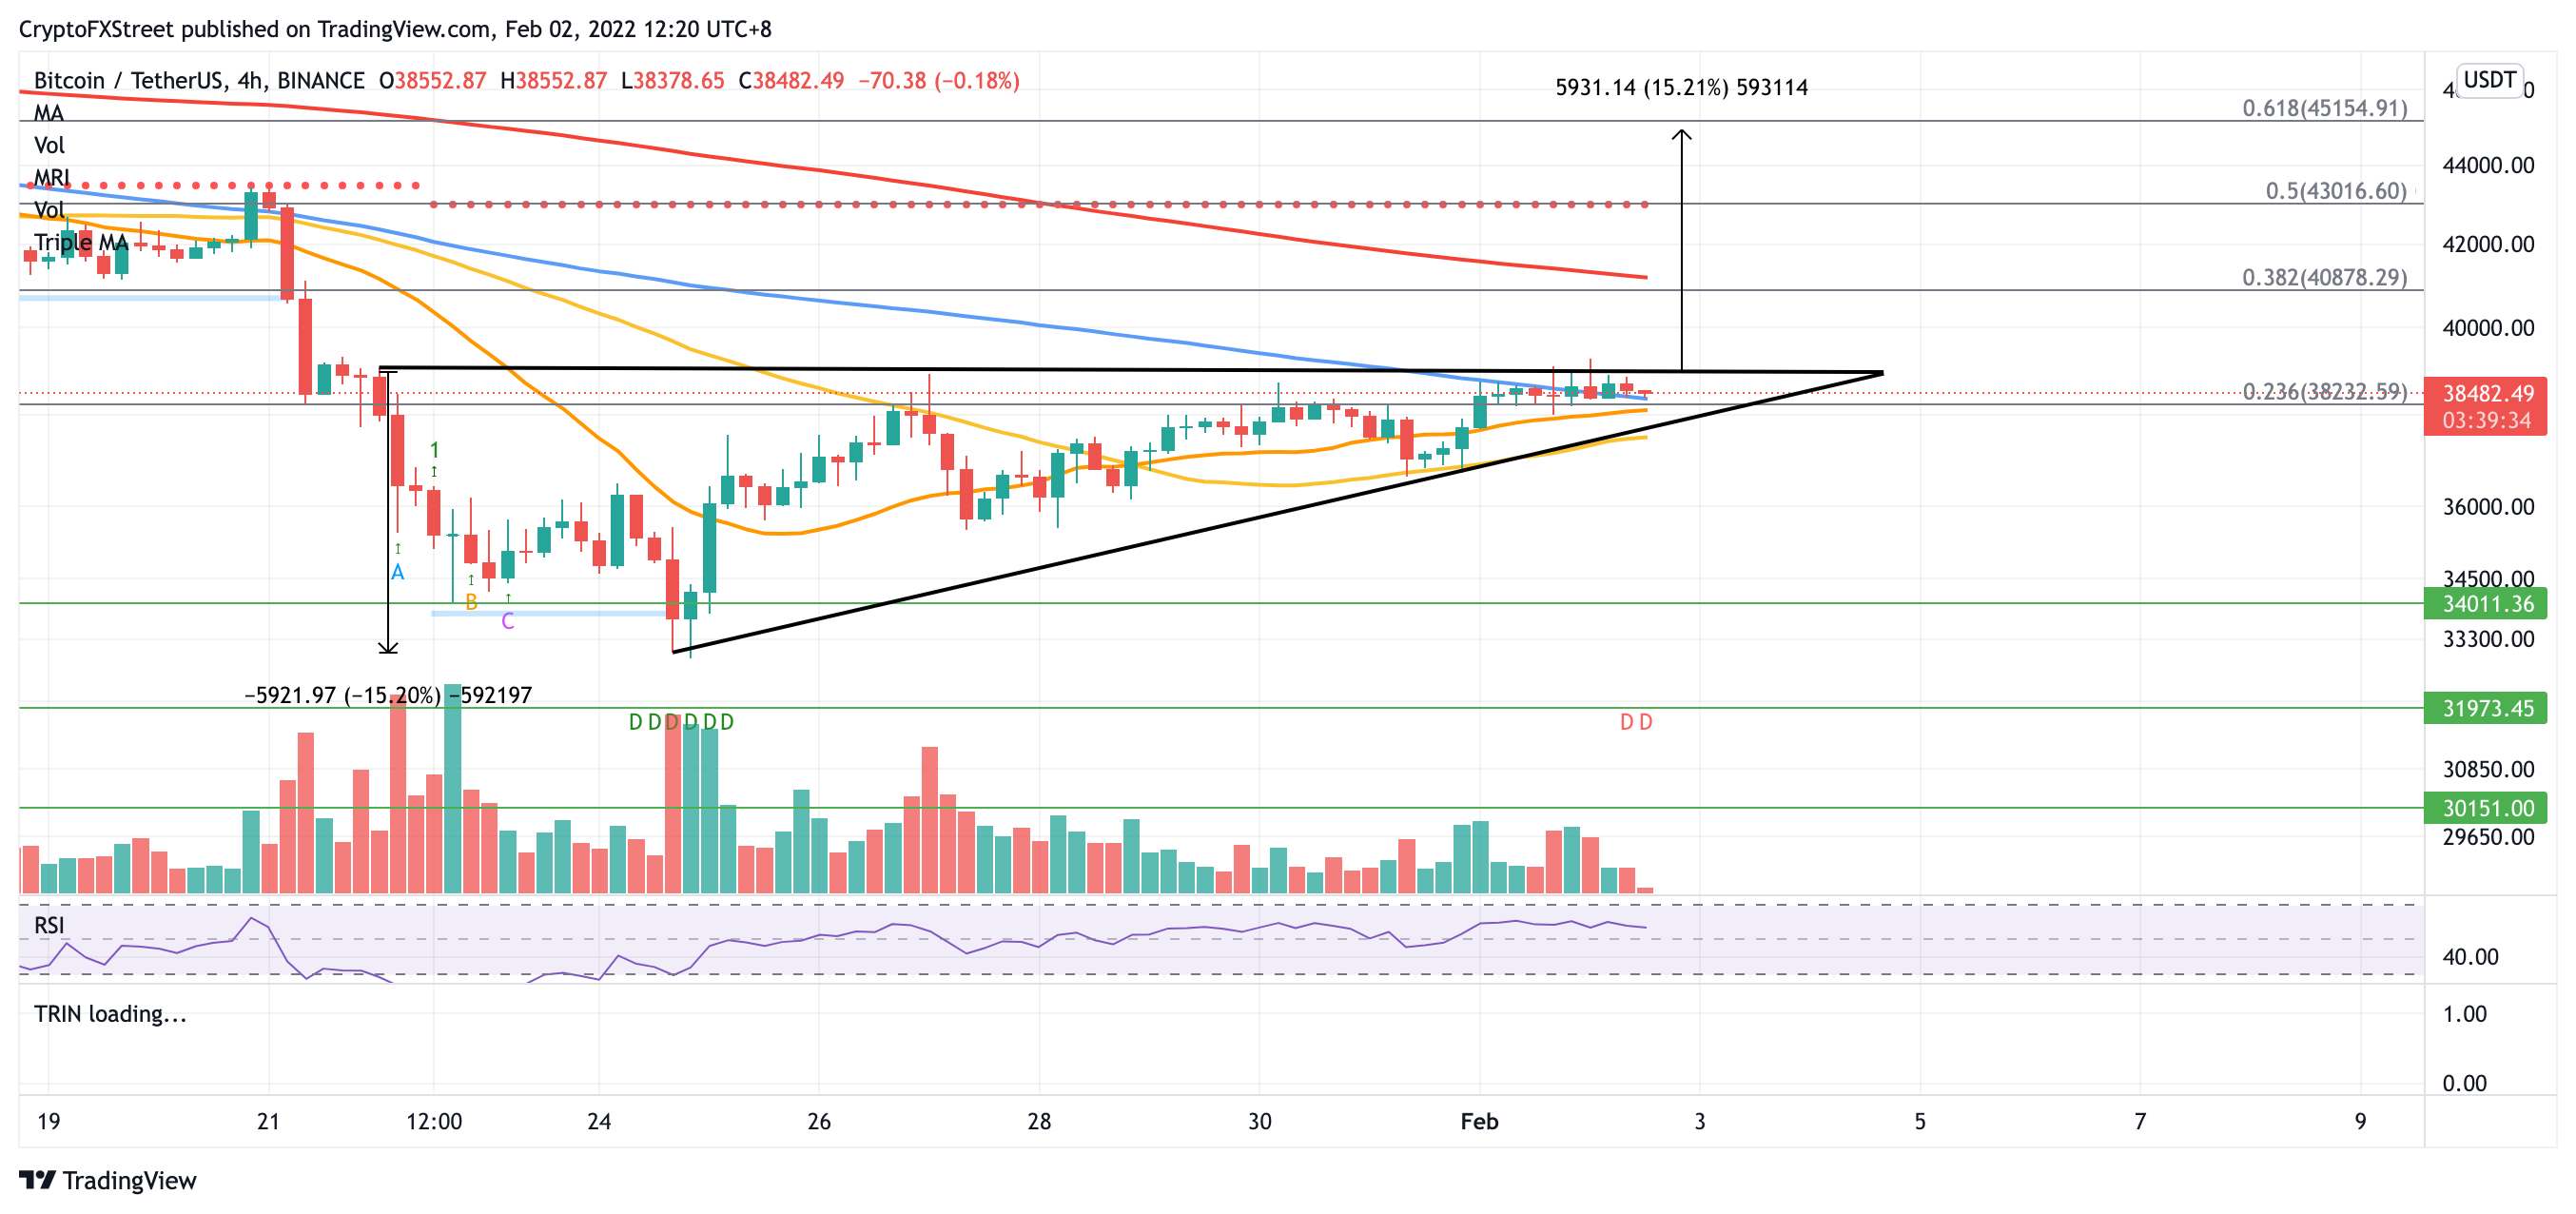
BTC/USDT 4-hour chart
If a spike in sell orders occurs, Bitcoin price will discover immediate support at $38,232, where the 21 four-hour SMA, 50 four-hour SMA and 23.6% Fibonacci retracement level intersect.
Author

Sarah Tran
Independent Analyst
Sarah has closely followed the growth of blockchain technology and its adoption since 2016.